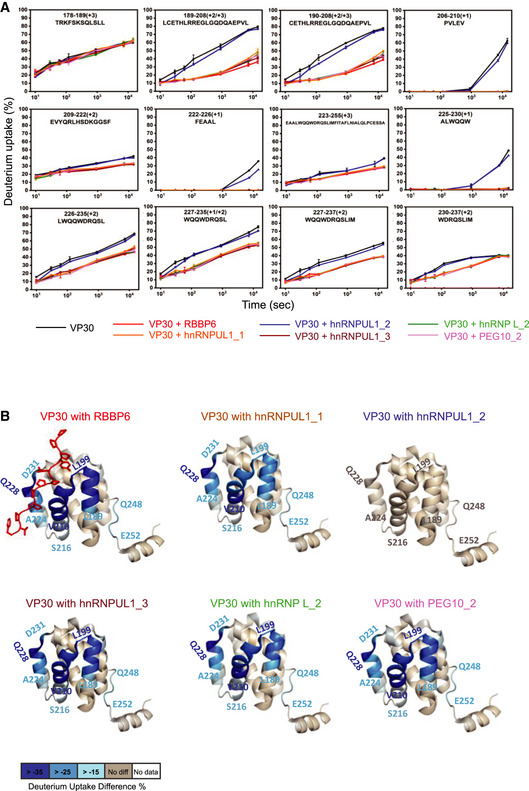
Figure 3. HDX‐MS analysis of VP30 and host factor peptide interactions.

- HDX kinetics data for VP30 alone and for the indicated host peptides incubated with VP30 are shown. VP30 peptide amino acid residue positions and sequences are indicated at the top of each curve. The error bars indicate mean ± SD (n = 3).
- Deuterium uptake differences were mapped onto the VP30 structure (PDB 6E5X), revealing similar binding regions for the peptides. Residue‐level uptake difference was achieved by overlapping peptides.
