FIGURE 6.

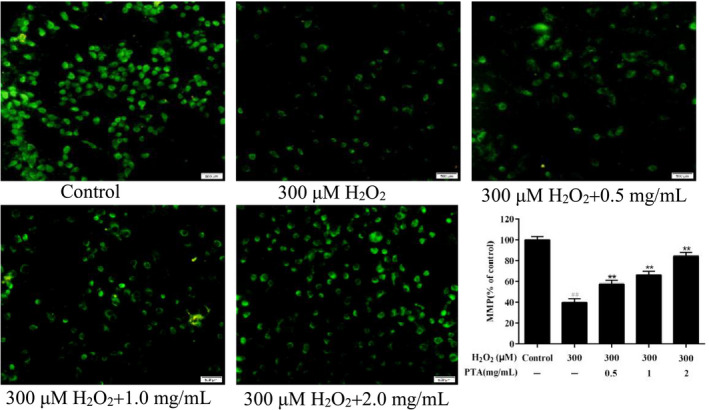
Effect of PTA on the decrease of mitochondria membrane potential level in HUVEC cells induced by H2O2. Data were displayed as the mean ± standard deviation. ##p < .01 versus control group, **p < .01 versus group treated with H2O2

Effect of PTA on the decrease of mitochondria membrane potential level in HUVEC cells induced by H2O2. Data were displayed as the mean ± standard deviation. ##p < .01 versus control group, **p < .01 versus group treated with H2O2