
FIGURE 1.
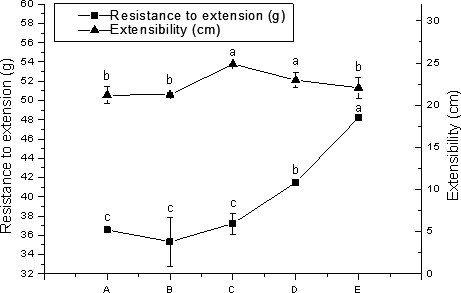
Resistance of wheat flour samples with different particle sizes to extension and extensibility. aData were expressed as the mean ± standard deviation. Values in the same column with different letters were significantly different at p < .05 (A: D 50 = 108.89 μm; B: D 50 = 88.13 μm; C: D 50 = 78.47 μm; D: D 50 = 65.73; E: D 50 = 52.36 μm)