FIGURE 6.

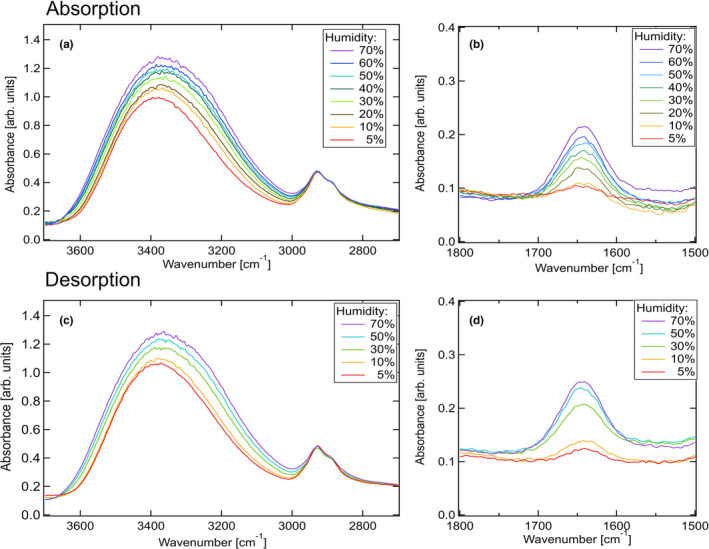
FT‐IR spectral profiles (absorption) in the regions spanning from (a) 3,700 to 2,700 cm‐1 and (b) 1,800 to 1,500 cm‐1. FT‐IR spectral profiles recorded during desorption in the regions spanning from (c) 3,700 to 2,700 cm‐1 and (d) 1,800 to 1,500 cm‐1
