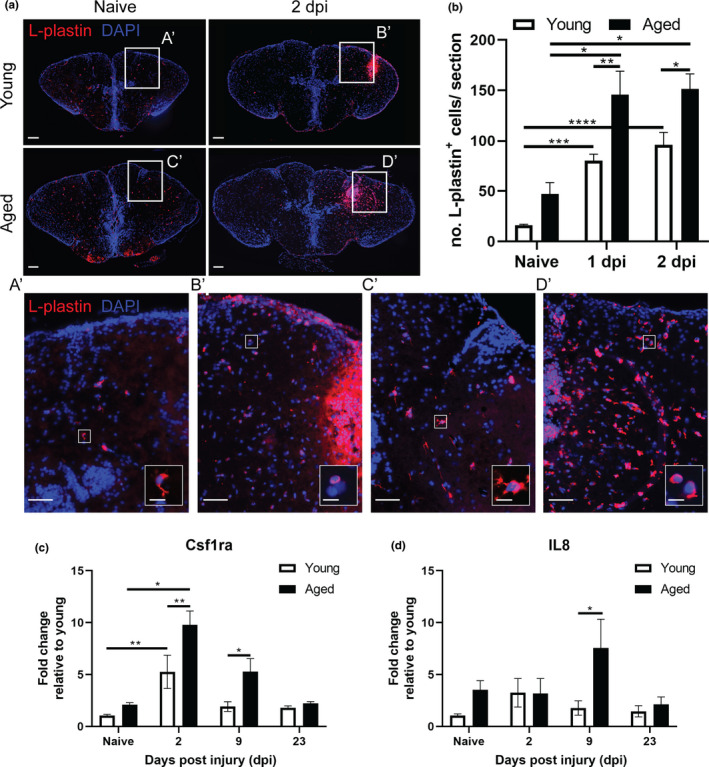
FIGURE 2.

The injury‐induced inflammatory reaction is larger in the aged brain. (a) Staining for L‐plastin (red) with DAPI (blue) on coronal brain sections of young adult and aged, naive and 2 dpi killifish. The increase in L‐plastin+ inflammatory cells is more pronounced in aged injured fish (A’–D’). Higher magnification of individual L‐plastin+ microglia/macrophages are presented in the right bottom corner. Scale bars: in a and A’–D’: 100 µm; in boxed areas in A’–D’: 10 µm. (b) Absolute number of L‐plastin+ microglia/macrophages in young adult and aged telencephali in naive conditions and at 1 and 2 dpi. Both age groups show a significant increase in inflammatory cells early after brain injury, but the number of microglia/macrophages is significantly higher in aged fish at 1 and 2 dpi. (c, d) Relative expression values of inflammation markers c sf1ra (c) and il 8 (d) in young and aged telencephalic, in naive conditions and at 2, 9, and 23 dpi. Aged killifish show higher and prolonged expression of c sf1ra and il 8 after injury compared to young fish. *p ≤ 0.05, **p ≤ 0.01, ***p ≤ 0.001, and ****p ≤ 0.0001; one‐way ANOVA is used to compare naive fish to injured fish. Young: parametric one‐way ANOVA, followed by Dunnett's multiple comparisons test. Aged: non‐parametric Kruskal–Wallis test, followed by Dunn's multiple comparisons test. Two‐way ANOVA is used to compare young and aged fish, followed by Sidak's multiple comparisons test. Values are mean ± SEM; n ≥ 4. dpi: days post‐injury, Csf1ra: colony‐stimulating factor 1 receptor a, and IL8: Interleukin 8
