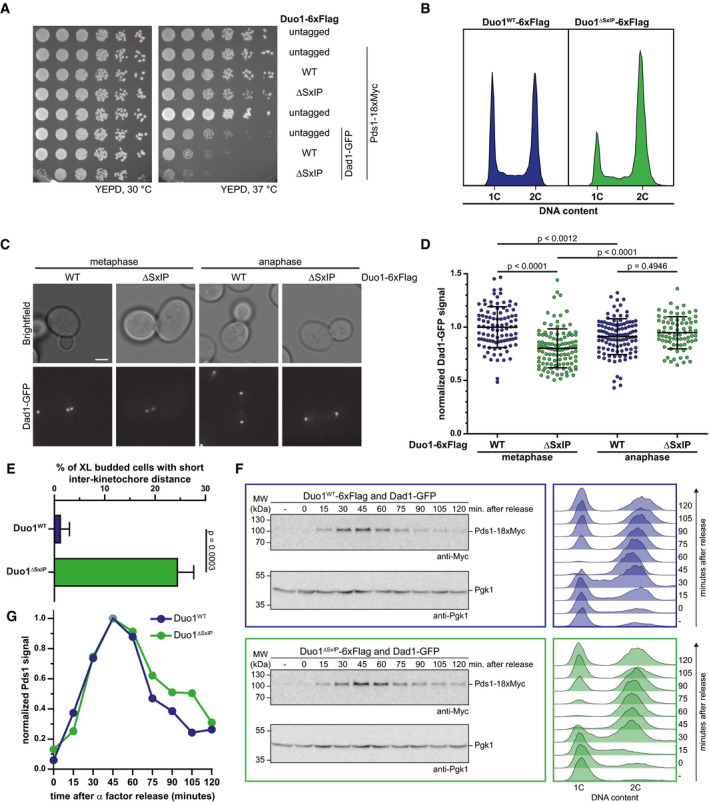
Serial dilution assay of yeast strains with different Duo1‐6xFlag alleles in a wild‐type or Dad1‐GFP strain background. Growth phenotypes of the respective yeast strains were analyzed by spotting serially diluted amounts of cells on YEPD plates and incubation at different temperatures.
FACS analysis of the DNA content of strains with Duo1WT‐6xFlag or Duo1ΔSxIP‐6xFlag alleles with untagged Dad1. Samples were taken from log phase cultures grown at 30°C. Cells with a 1C DNA content are in G1 phase, a 2C DNA content is characteristic of mitotic cells. Cells with an intermediate DNA content are in S phase.
Representative images from fluorescence live cell microscopy of Dad1‐GFP strains with Duo1WT‐6xFlag or Duo1ΔSxIP‐6xFlag. Displayed cells are in either metaphase (left) or anaphase (right). Scale bar: 2 μm.
Quantification of signal intensities of Dad1‐GFP at metaphase and anaphase kinetochore clusters of Duo1WT‐6xFlag and Duo1ΔSxIP‐6xFlag strains. Bars represent the mean ± standard deviation. Each spot represents the value measured for a single kinetochore cluster. Values were normalized to the mean value of metaphase clusters of the Duo1WT‐6xFlag strain. A one‐way ANOVA test with Sidak's multiple comparisons test was used to calculate P‐values. n ≥ 76 kinetochore clusters.
Quantification of extra‐large (XL) budded cells with short inter‐kinetochore distance. Only cells with buds that were grown to more than half of the mother cell's size were counted. Mean ± standard deviation from three independent experiments are displayed. P‐value was calculated by an unpaired t‐test.
Analysis of cell cycle progression of yeast strains with different Duo1 alleles. Accumulation and degradation of Pds1 after release from α factor arrest was analyzed by Western blot (left). An antibody against Pgk1 was used to confirm equal protein amounts in samples. The DNA content of the cell population at indicated time points after release from α factor arrest was analyzed by FACS (right). Cells in G1 phase and mitosis are characterized by a 1C and 2C DNA content, respectively. An intermediate DNA content is detected for cells in S phase.
Pds1 signal intensities from Western blots shown in F were quantified and corrected for Pgk1 signal of the corresponding sample. Finally, the highest signal intensity (45 min after release) was defined as 1.00 and values for other time points were normalized accordingly.

