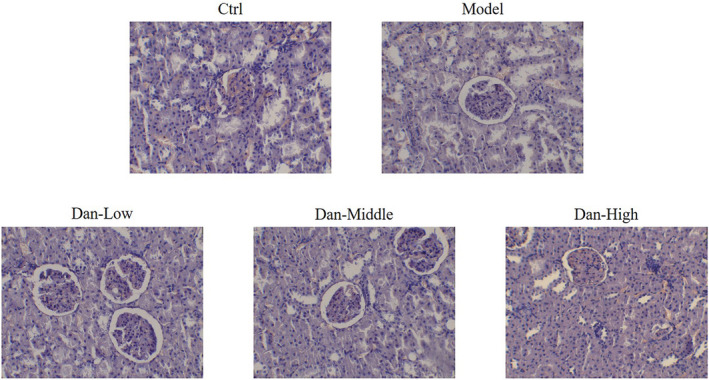
FIGURE 1.

Pathomorphological changes in the renal tissues of rats in each group by HE staining (200×). Ctrl: The rats were treated normally; Model: The rats were given DN model treatment; Dan‐Low: DN model rats treated with 10 mg/kg•day Dan; Dan‐Middle: DN model rats treated with 20 mg/kg•day Dan; Dan‐High: DN model rats treated with 100 mg/kg•day Dan
