FIGURE 3.

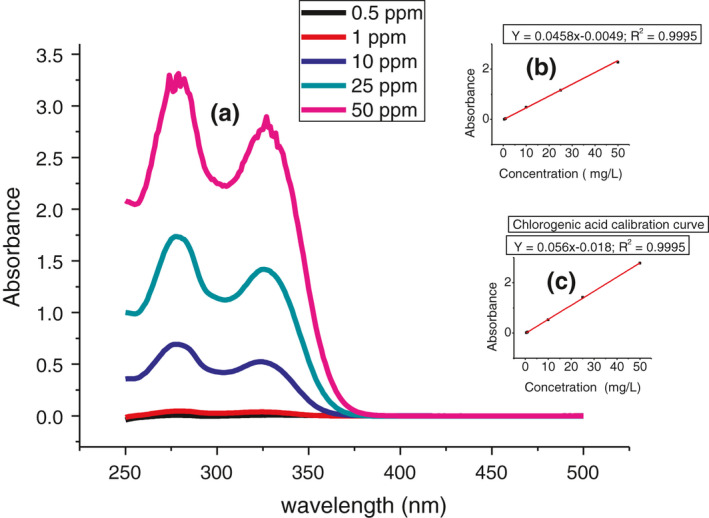
UV‐Vis spectra of caffeine and chlorogenic acid mixture (a); calibration curve of caffeine (b) and Chlorogenic acid (c). NB: Absorbance of caffeine was calculated using Equation 2

UV‐Vis spectra of caffeine and chlorogenic acid mixture (a); calibration curve of caffeine (b) and Chlorogenic acid (c). NB: Absorbance of caffeine was calculated using Equation 2