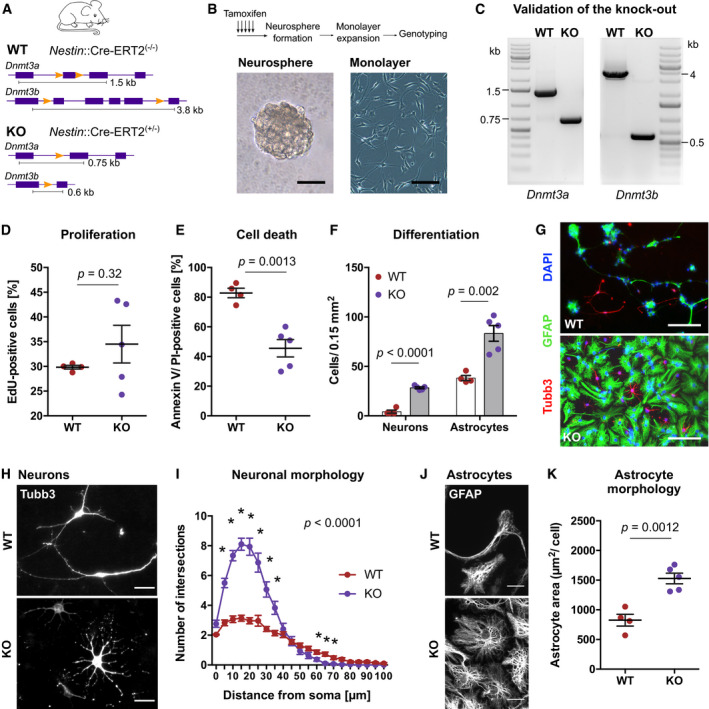
Figure 2. De novo DNA methyltransferases control neuronal differentiation from adult hippocampal NPCs in vitro .

-
ASchematic representation of the genomic area of Dnmt3a and Dnmt3b in wildtype (WT) mice and conditional knock‐out (KO) mice. WT mice were Nestin::Cre‐ERT2(−/−)/Dnmt3a fl/fl/Dnmt3b fl/fl, while KO mice were Nestin::Cre‐ERT2(−/+)/Dnmt3a fl/fl/Dnmt3b fl/fl.
-
BDentate gyri from WT and KO mice were dissociated 10 days after tamoxifen administration and plated for neurosphere formation. NPC monolayer cultures were generated from single neurospheres. Representative pictures of neurosphere (left) and neurosphere‐derived adherent monolayer culture (right). Scale bars: 50 µm.
-
CRepresentative images of polymerase chain reaction used for genotyping of NPC lines.
-
DDnmt3a/b‐KO did not affect NPC proliferation. Depicted are data points for every cell line with genotype means ± standard errors of the mean (SEM).
-
EReduced percentage of dead cells (Annexin V/propidium iodide [PI] double‐positive) in KO cultures at 46 h after start of differentiation. Depicted are data points for every cell line with genotype means ± SEM.
-
F, GNPCs from WT and KO mice differentiated into astrocytes (GFAP‐positive) and neurons (Tubb3‐positive). Increased numbers of both neurons and astrocytes were generated from KO NPCs. Depicted are data points for every cell line with genotype means ± SEM. Scale bar: 100 µm.
-
HHigh‐magnification fluorescent image of differentiated neurons. Scale bar: 20 µm.
-
ISholl analysis of Tubb3‐labeled WT and KO neurons (n = 29 neurons, WT; n = 30 neurons, KO). Reported P–value corresponds to genotype effect from two‐way ANOVA. Asterisks highlight data points with P < 0.05 after multiple testing adjustment (Holm method) of repeated t‐tests. Depicted are means ± SEM.
-
JHigh‐magnification fluorescent image of differentiated astrocytes. Scale bar: 20 µm.
-
KAstrocytes from KO cultures covered a larger area than WT astrocytes. Data points represent means of individual cell lines (n > 30 astrocytes per cell line). Depicted are data points per culture with genotype means ± SEM.
Data information: Depicted P‐values in panels (D), (E), (F), (K) are from unpaired t‐test. Sample sizes: n = 4 cultures, WT; n = 5 cultures, KO. Further statistical details are reported in Appendix Table S5.
