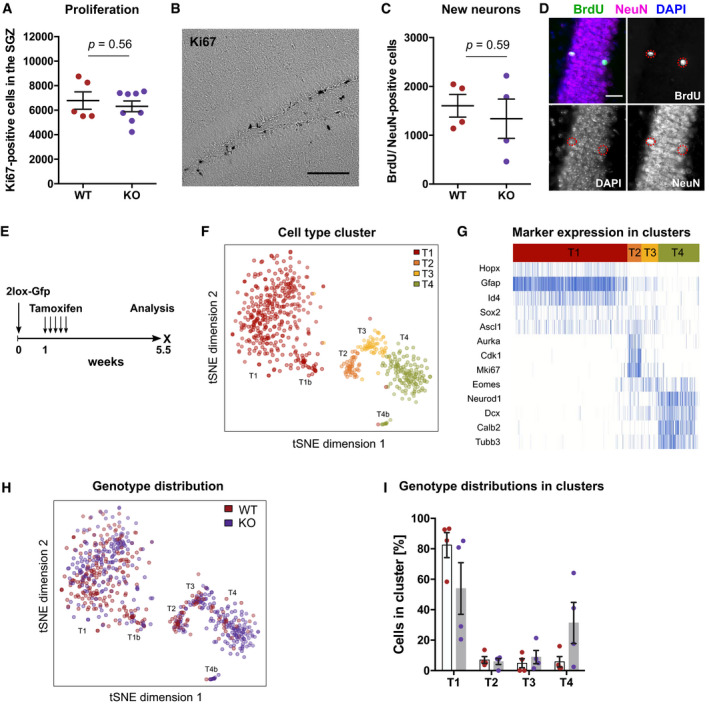
No difference in numbers of Ki67‐positive, proliferating cells was observed between the subgranular zone (SGZ) of Dnmt3a/b‐WT and Dnmt3a/b‐KO mice 1 week after tamoxifen administration. Depicted are data points for every animal with genotype means ± SEM.
Bright‐field image of Ki67‐positive cells stained using diaminobenzidine method. Scale bar: 100 µm.
KO of Dnmt3a/b did not affect numbers of newborn neurons in the dentate gyrus. Mice were administered with tamoxifen and analyzed 5 weeks after the first injection. BrdU was injected 3.5 weeks before analysis. Depicted are data points for every animal with genotype means ± SEM.
Fluorescence image of BrdU/NeuN‐positive newborn neurons. Scale bar: 25 µm.
Experimental scheme for results depicted in Figs
4F–I,
5A and B, and
EV3B and C. Recombined WT and KO cells were identified by Gfp expression in
Nestin::Cre‐ERT2 mice.
Gfp‐positive cells were isolated by FACS from WT and KO mice and their transcriptional profile analyzed using single‐cell RNA sequencing (n = 4 mice per genotype). t‐distributed stochastic neighborhood embedding (t‐SNE) clustered cells into four populations which were labeled with T1–T4 and highlighted by color. Clusters T1b and T4b were identified as sub‐clusters of T1 and T4, respectively.
Marker expression identified the cell clusters as distinct cell stages during adult hippocampal neurogenesis.
Distribution of WT (red) and KO cells (violet) into the different cell clusters.
Percentages of WT and KO cells in the different cell clusters relative to all sufficiently covered cells (in total n = 293 cells from 4 mice, WT; n = 344 cells from four mice, KO). Depicted are percentages of cells in cluster per animal (individual data points) with genotype means ± SEM.

