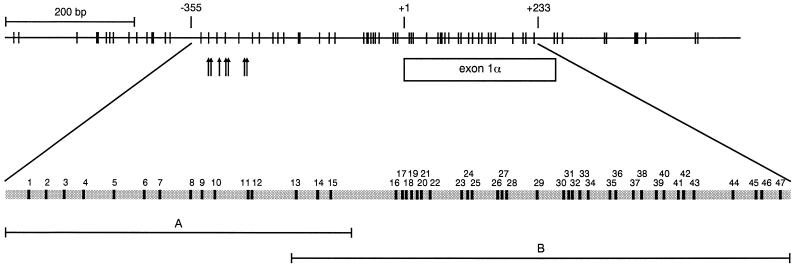
FIG. 1.
Genomic map of the 5′ CpG island of the p16 gene. This CpG map is based on published genomic DNA sequences (GenBank accession no. AF022809, U12818, and AC000048). CpG sites and their genomic positions within 1.2 kb of the p16 CpG island (−621 to +521) are represented by vertical lines at the top. Nucleotide positions are numbered relative to the translation start site (+1). The genomic positions of the putative transcription start sites for the p16 gene are represented by arrows. The coding region of exon 1α is shown. The gray bar at the bottom represents a magnification of the region, from −355 to +233, that was analyzed for methylation in this study. The 47 CpG sites (black boxes within the gray bar) in this region are numbered according to their 5′-to-3′ order in the p16 genomic sequence and positioned based on their location within the genomic sequence. PCR products A (−355 to −73) and B (−159 to +233), amplified from bisulfite-treated DNA for sequencing, are shown.

