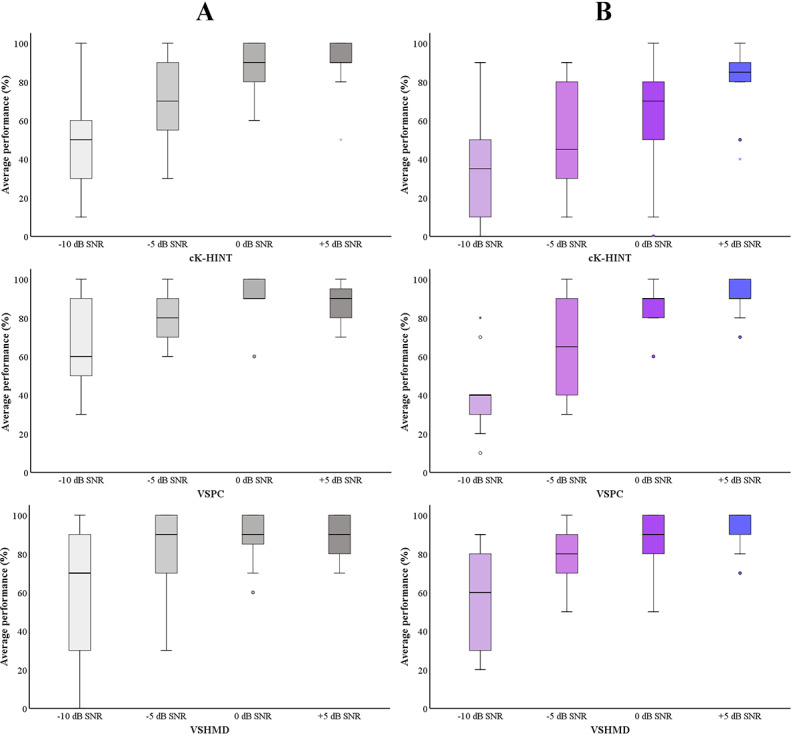
Figure 4.

Statistical analysis of the groups’ average speech performance. Gray bars (A) indicate non–hearing aid users’ performance. Purple bars (B) indicate hearing aid users’ performance. The horizontal lines within the shaded bars represent the median values, the shaded bars represent IQRs, the error whiskers represent the highest and lowest points, and the circles and stars represent outliers and extreme outliers, respectively. cK-HINT: conventional Korean version of the Hearing in Noise Test; SNR: signal-to-noise ratio; VSHMD: virtual space head-mounted display; VSPC: virtual space on PC.
