FIGURE 1.

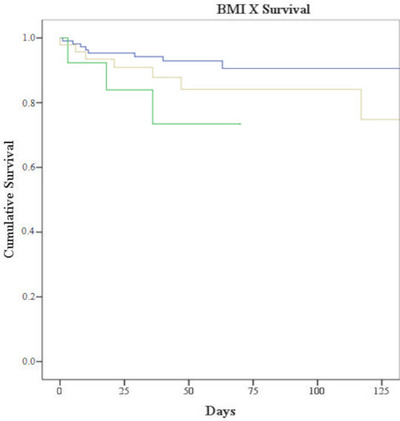
Survival according to bodymass index (BMI). Underweight: green line; Overweight and obesity: yellow line; Adequate BMI: blue line (p = .007)

Survival according to bodymass index (BMI). Underweight: green line; Overweight and obesity: yellow line; Adequate BMI: blue line (p = .007)