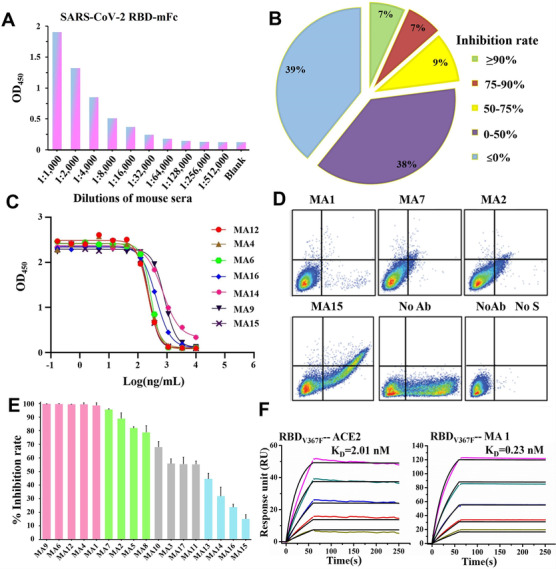
FIGURE 1.

Characterization of RBD‐specific mAbs inhibiting binding of the S to ACE2 receptor. (A) Serological antibody responses to the SARS‐CoV‐2 RBD‐mFc evaluated by ELISA. (B) Diagram shows the percentage of hybridoma clones with different competition levels against ACE2 binding to the SARS‐CoV‐2 RBD. Inhibition rate ≦ 0% indicated approximately 39% of total clones could not compete with ACE2. (C) Inhibitory curves of representative mAbs competing with ACE2. (D) Representative mAbs block SARS‐CoV‐2 S binding to ACE2 in FACS‐based assay. (E) The inhibition rate of all selected mAbs was measured by flow cytometry with 10 μg/ml of each antibody, and experiments were performed three times. (F) Binding kinetics of MA1 and ACE2 with SARS‐CoV‐2 RBDV367F. The purified soluble SARS‐CoV‐2 RBDV367F was covalently immobilized onto a CM5 sensor chip followed by injection of ACE2 or MA1 with five different concentrations. The black line indicates the experimentally derived curves, and the colored lines represent the fitted curves based on the experimental data
