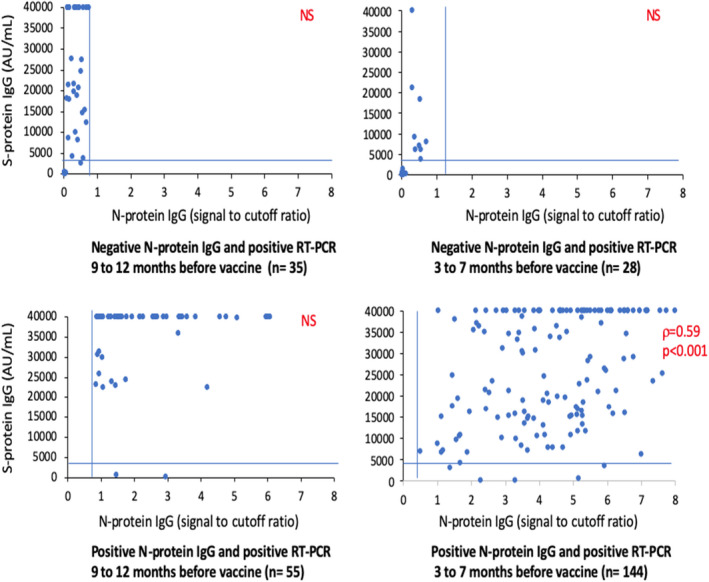
FIGURE 2.

Correlation between N‐ and S‐protein IgG depending on the time of the COVID‐19 infection, 3 weeks after the first jab. Legend: N‐protein IgG levels: positive value when ≥0.8 signal to cutoff ratio (vertical bars); S‐protein IgG levels: high values when ≥4160 arbitrary unit (AU)/ml (horizontal bar)
