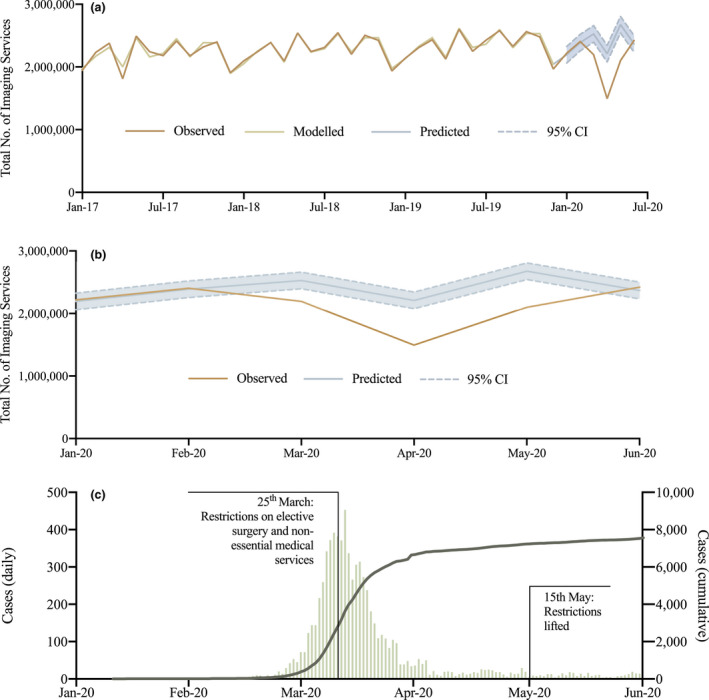
Fig. 1.

Total imaging services performed in Australia during the COVID‐19 pandemic. (a) Observed total imaging services between January 2017 and June 2020, modelled total imaging services between January 2017 and December 2019 with predicted (with 95% confidence interval) total imaging services between January 2020 and June 2020. (b) Observed and predicted (with 95% confidence interval) total imaging services between January 2020 and June 2020. (c) Daily (left axis) and cumulative (right axis) COVID‐19 cases in Australia with key time points for restrictions on healthcare delivery indicated.
