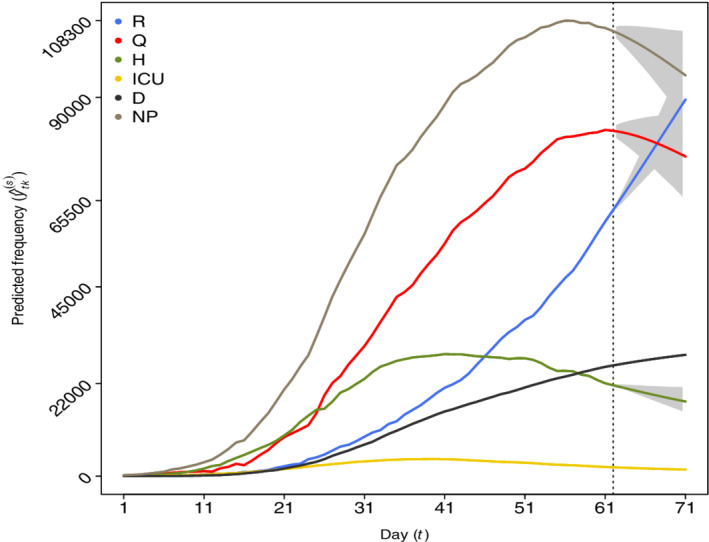
FIGURE 1.

Observed frequencies (before the vertical dashed line corresponding to the 25th of April) and 10 days predictions (after the vertical line until the 4th of May) with Model 8 for categories: recovered (R), positive cases in quarantine (Q), hospitalized (H), intensive care (ICU), deceased (D), and “now positive” (NP). The estimated 95% prediction intervals are visualized in gray [Colour figure can be viewed at wileyonlinelibrary.com]
