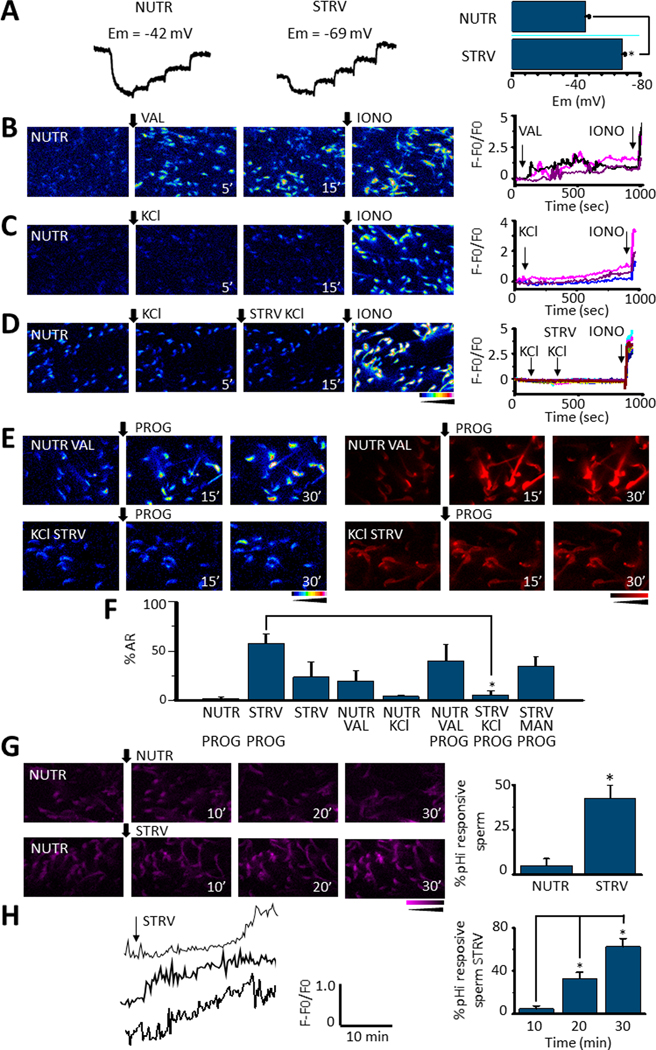
Fig. 6.

A. Representative DiSC3(5) fluorescence traces corresponding to sperm Em measurements during NUTR or STRV media incubation. Calibration was performed by adding 1 μM valinomycin followed by incremental KCl concentration additions (left and middle panels). Bars summarize Em values of the sperm population obtained after each condition. They show that STRV medium application significantly hyperpolarizes Em (p = 2.4E-6, t = −9.5, n=6) (right panel) B. [Ca2+]i responses to 1 μM valinomycin (VAL) addition to sperm incubated in NUTR medium. In B, C and D ionomycin (IONO) was added at the end of the experiment as a positive control and traces on the right panels correspond to individual sperm in the respective field. [Ca2+]i traces corresponding to some cells in the left panel show that valinomycin induces sperm [Ca2+]i increases (right panel). C. In contrast, 80 mM KCl only promotes a slow and small [Ca2+]i response in sperm in NUTR medium. D. [Ca2+]i responses 5 minutes after a KCl addition to sperm incubated in NUTR medium. Thereafter, cells were changed to STRV conditions and KCl applied; the image was recorded 15 minutes later. Neither in NUTR medium nor in STRV conditions was a KCl addition able to induce [Ca2+]i increases in non-capacitated sperm. However, ionomycin application promoted a clear [Ca2+]i response (right panel). E. [Ca2+]i and AR measurements of sperm pre-incubated with either valinomycin in NUTR medium or KCL under STRV conditions and then stimulated by progesterone (PROG), recording images at 15 and 30 minutes. F. Quantification of AR of experiments in E plus an osmotic control of the KCl addition in response to PROG. The results show that sperm pre-incubation in STRV medium in the presence of KCl significantly reduced AR promoted by progesterone, in comparison to cells pre-incubated in STRV medium alone (p = 1.2E-4, t = −6.8, n=5). G. Fluorescence images showing pHi changes after NUTR or STRV medium application (left panel). Percentage of sperm that display pHi increases under NUTR or STRV conditions. STRV medium application significantly elevated pHi in sperm (p = 5.0E-4, t = 6.7, n=5) (right panel). H. Representative single-cell pHi responses observed after STRV medium application (left panel). The right panel summarizes the percentage of sperm that manifest pHi increases at different times after STRV medium addition (paired t-test 10 vs 20min p = 0.012, t = −5.38; 20 vs 30 min, p = 0.03, t = −3.65, n=5 (right panel). Black arrows indicate the time 0’ for all applications and the time on the bottom when the image was recorded. All quantified results are expressed as the mean ± S.E. A t-Test was applied for statistical analysis * indicates statistically significant differences, p value < 0.05
