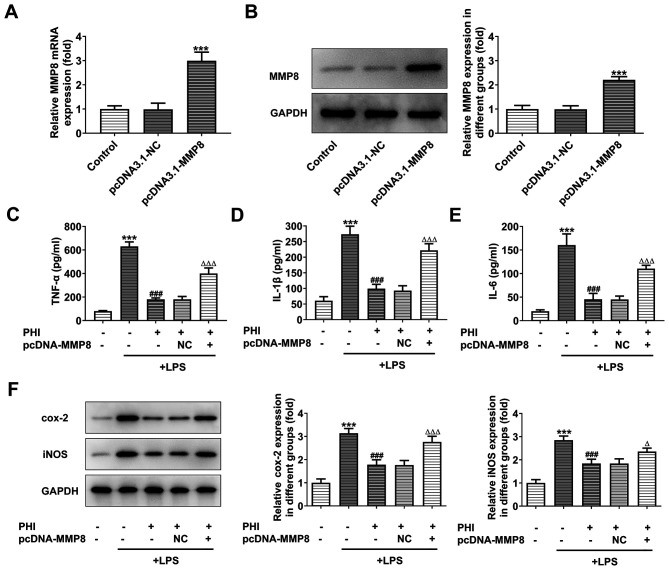
Figure 4.
PHI treatment suppresses inflammation of LPS-induced BEAS-2B cells. pcDNA3.1-MMP8 was constructed and the expression levels of MMP8 were measured via (A) reverse transcription-quantitative PCR and (B) western blot analyses. ***P<0.001 vs. control and pcDNA3.1-NC. (C-E) Following transfection of pcDNA3.1-MMP8 into LPS-induced BEAS-2B cells pretreated with PHI, the expression levels of the inflammatory factors were measured via ELISA. ***P<0.001 vs. control; ###P<0.001 vs. LPS group; ∆∆∆P<0.001 vs. LPS + PHI group. (F) Following transfection of pcDNA3.1-MMP8 into LPS-induced BEAS-2B cells pretreated with PHI, the expression levels of the inflammation-associated factors were measured via western blotting. ***P<0.001 vs. control; ###P<0.001 vs. LPS group; ∆P<0.05, ∆∆∆P<0.001 vs. LPS + PHI group. PHI, phillygenin; LPS, lipopolysaccharide; NC, negative control; cox-2, cyclooxygenase-2; iNOS, inducible nitric oxide synthase.

