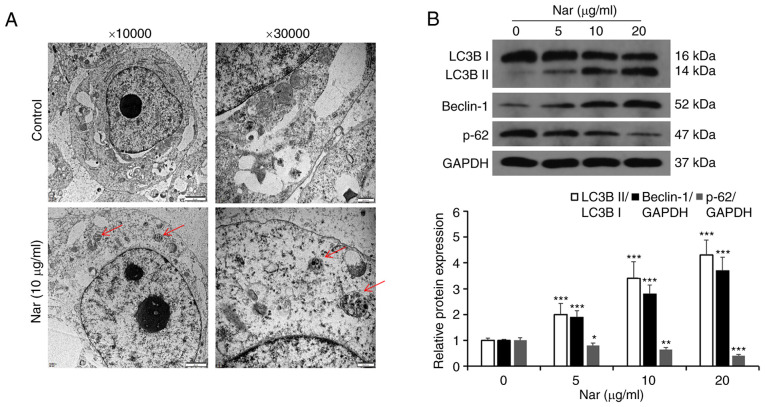
Figure 6.
Nar induces autophagy in SNU-1 cells. (A) The autophagic microstructures were observed by transmission electron microscopy [red arrow: Autophagic vacuole (autophagosome or autophagosome)]. (B) The levels of cell autophagy-associated proteins were determined by western blot analysis. GAPDH expression was used to normalize the data. *P<0.05, **P<0.01, ***P<0.001 vs. the control group. Nar, naringin; LC3B, microtubule-associated protein 1 light chain 3 β.

