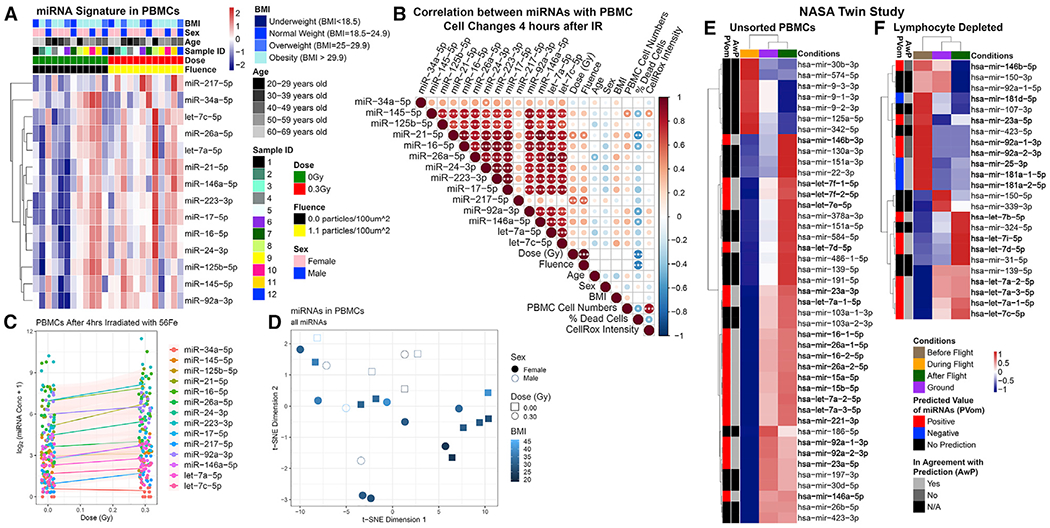
Figure 4. Quantification of miRNAs in Human Samples Exposed to Spaceflight or IR.

(A) Comparison of human peripheral blood mononuclear cell (PBMC) samples from 12 subjects 4 h post-irradiation with 0.3 Gy or sham (0 Gy) 56Fe irradiation.
(B) Correlation between miRNA quantities and cell phenotypes 4 h post-irradiation. The significance of each correlation is indicated in the circles. *p < 0.05, **p < 0.01, ***p < 0.001, two-tailed Student’s t test. Circle size is proportional to the correlation coefficient.
(C) General additive model fit of the miRNA quantities as a function of dose.
(D) t-SNE plot of the samples clustering as a function of BMI based on miRNA concentration.
(E and F) NASA Twins Study data for (E) unsorted PBMCs and (F) LD cells in comparison to the spaceflight miRNA signature predictions.
