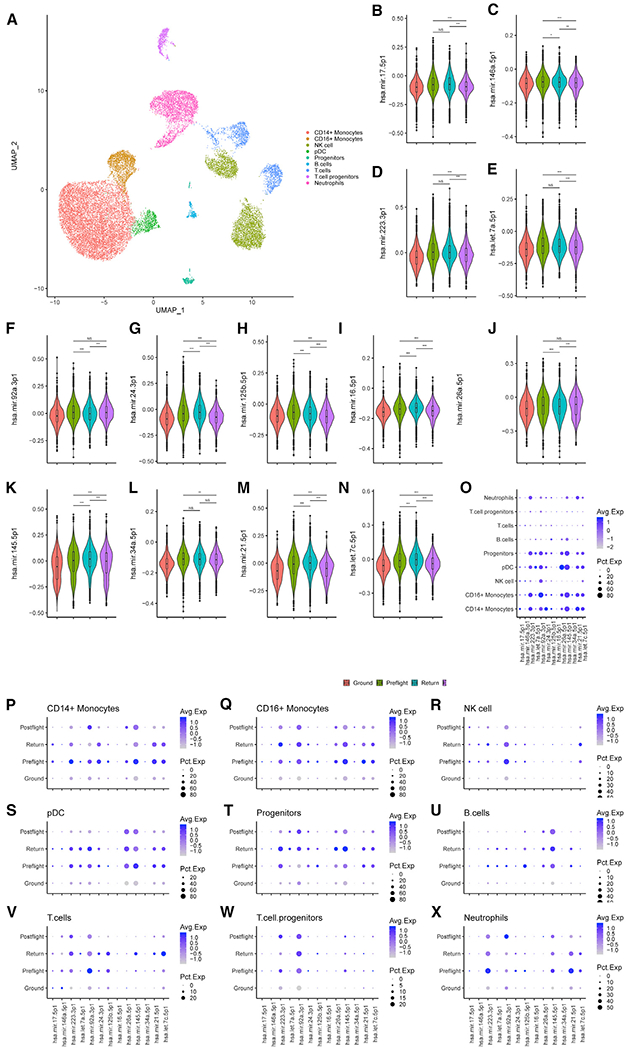
Figure 5. Spaceflight-Associated miRNA Target Genes Are Downregulated upon TW Return and Postflight Compared to Preflight, with Individual Cell Types Being Differentially Affected.

(A) Uniform manifold approximation and projection (UMAP) plot of 23,408 cells grouped by cell-type-identified clusters.
(B–N) Violin plots with mean and first and third quartiles of the indicated miRNA target gene module scores. Cells were separated into four groups: cells from HR GD114, GD138, GD182, GD3, GD-66, and GD66 as Ground; TW L-162 and L-148 days as Preflight; TW R0 as Return; and TW R36 and R191 as Postflight. Differences in expression of miRNA target gene modules scores was tested by Wilcoxon rank sum test. *p < 0.05, **p < 0.01, ***p < 0.001.
(O–W) Dot plots colored by average expression and size based on percent expression of the spaceflight-associated mRNA target gene module scores of cell types grouped by Ground, Preflight, Return, and Postflight.
