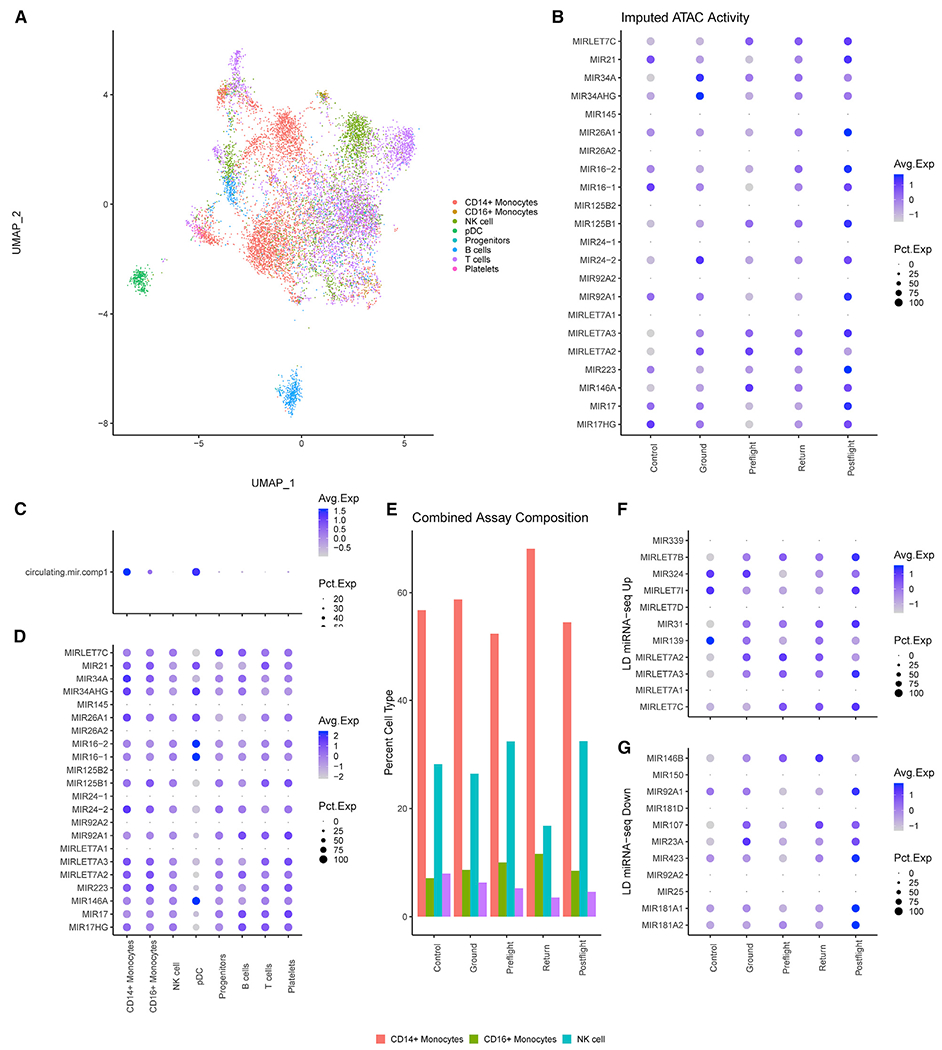
Figure 6. Spaceflight Does Not Induce Epigenetic Changes around Spaceflight-Associated miRNA.

(A) UMAP plot of 11,344 cells grouped by cell type predicted by Seurat’s transfer anchor function from the 10× PBMC dataset (see Method Details).
(B) Dot plot colored by ATAC activity and sized based on percentage ATAC activity at the 5-kb bins associated with spaceflight-associated miRNA. Cells were separated into five groups: cells from the control (non-LD) PBMCs as Control, HR GD-66 and GD125 as Ground, TW L-71 as Preflight, TW R3 as Return, and TW R36 as Postflight.
(C) Dot plot of spaceflight-associated miRNA module scores with cells grouped by cell type across all samples.
(D) Dot plot of the individual spaceflight-associated miRNA ATAC activity with cells grouped by cell type.
(E) Composition analysis per group based after removal of B and T cells across both scATAC and scRNA analysis.
(F and G) Dot plots of ATAC activity at miRNA upregulated (F) or downregulated (G) in the LD miRNA-seq.
