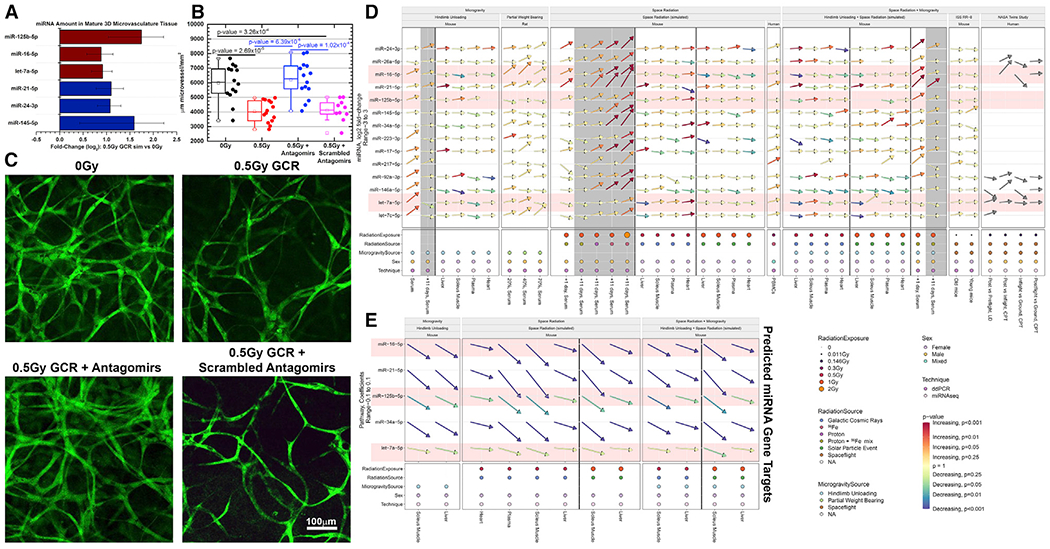
Figure 7. miRNA Changes and Impacts in a 3D Microvascular Tissue Model.

(A) Quantification of miRNAs from a 3D culture of mature human microvessels with human umbilical vein endothelial cells (HUVECs) irradiated with 0.5 Gy of simplified simulated galactic cosmic rays (SimGCRSim) compared to sham irradiated samples 48 h after irradiation. All candidate miRNAs were examined, but only the miRNAs that seemed to respond differently for each group are shown. The error bars represent SEM.
(B and C) Mature microvessels fixed and fluorescently stained with 5-(4,6-dichlorotriazinyl) aminofluorescein (DTAF) (Method Details) 48 h after SimGCRSim irradiation with or without antagomir-induced inhibition of miR-125b, miR-16, and let-7a starting at 24 h prior to irradiation. Scrambled version of the antagomir was used a vehicle control.
(D) Summary of all the fold-change values for all experiments utilized in this manuscript (including both ddPCR and miRNA-seq data).
(E) The summary of the overall impact of the miRNAs on the gene targets determined in Figure 3D through pathway analysis on the miRNA-seq data. The arrows indicate the degree of up- or downregulation, and the colors of the arrows indicate the significance (i.e., p values). The gray-shaded regions represent the 11-day time points after irradiation. The red-shaded miRNAs represent the miRNAs used for the antagomir experiments in (B) and (C).
