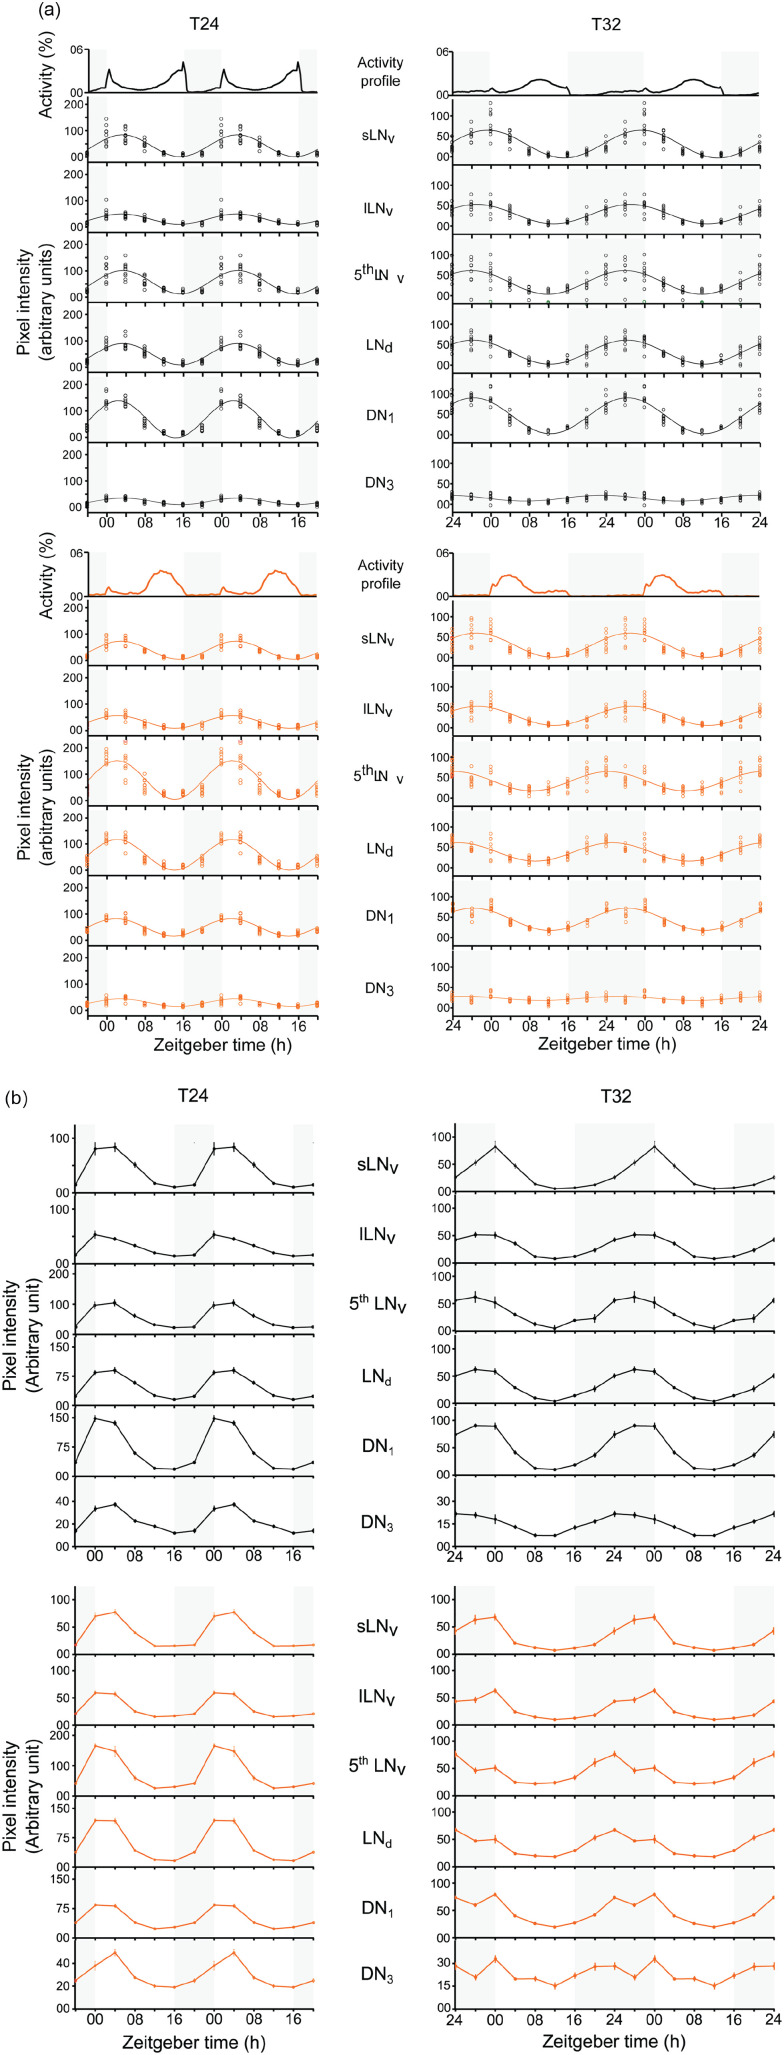
Figure 4.
PER rhythms in clock neurons of wildtype and Pdf 0 flies. (a) Scatter plots of background corrected nuclear PER intensities in clock neurons of wildtype (upper panels) and Pdf 0 mutant (lower panels) flies entrained to T24 and T36. Each open circle represents the mean PER staining intensity in a clock neuron group estimated from replicate brains in a sample. The solid line depicts the best-fitting COSINE curve obtained by single-component COSINOR analysis. (b) Line plots of mean nuclear PER intensity plotted as a function of time after lights-on (h) in clock neurons of wildtype (upper panels) and Pdf 0 (lower panels) flies entrained to T24 and T36. The staining intensity represents an average over intensity estimates from replicate brain tissues in a sample. Error bars are Standard Error of Means. Abbreviations: PER = PERIOD protein; s-LNvs = small lateral ventral neurons; l-LNvs = large lateral ventral neurons; LNds = lateral dorsal neurons; DN1 = dorsal neurons 1; DN3 = dorsal neurons 3.

