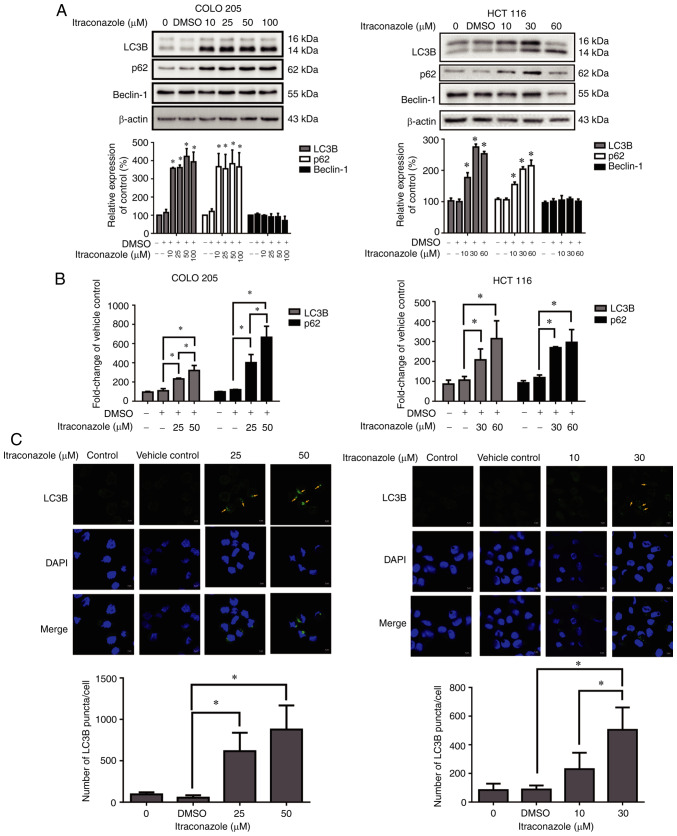
Figure 3.
Itraconazole induces autophagic proteins and LC3B puncta expression. COLO 205 and HCT 116 cells were treated with different concentrations of itraconazole, and the (A) protein expression levels of LC3B, p62, Beclin-1 and β-actin were detected via western blot analysis, while (B) the mRNA expression levels were detected via reverse transcription-quantitative PCR analysis. (C) COLO 205 and HCT 116 cells were treated with itraconazole for 24 h and LC3B puncta was detected via confocal microscopy (software: ZEN, version: 2.6) (yellow arrows). The number of LC3B puncta/cell were quantified using ImageJ software (Version 1.50i; National Institutes of Health). *P<0.05 vs. vehicle control group.

