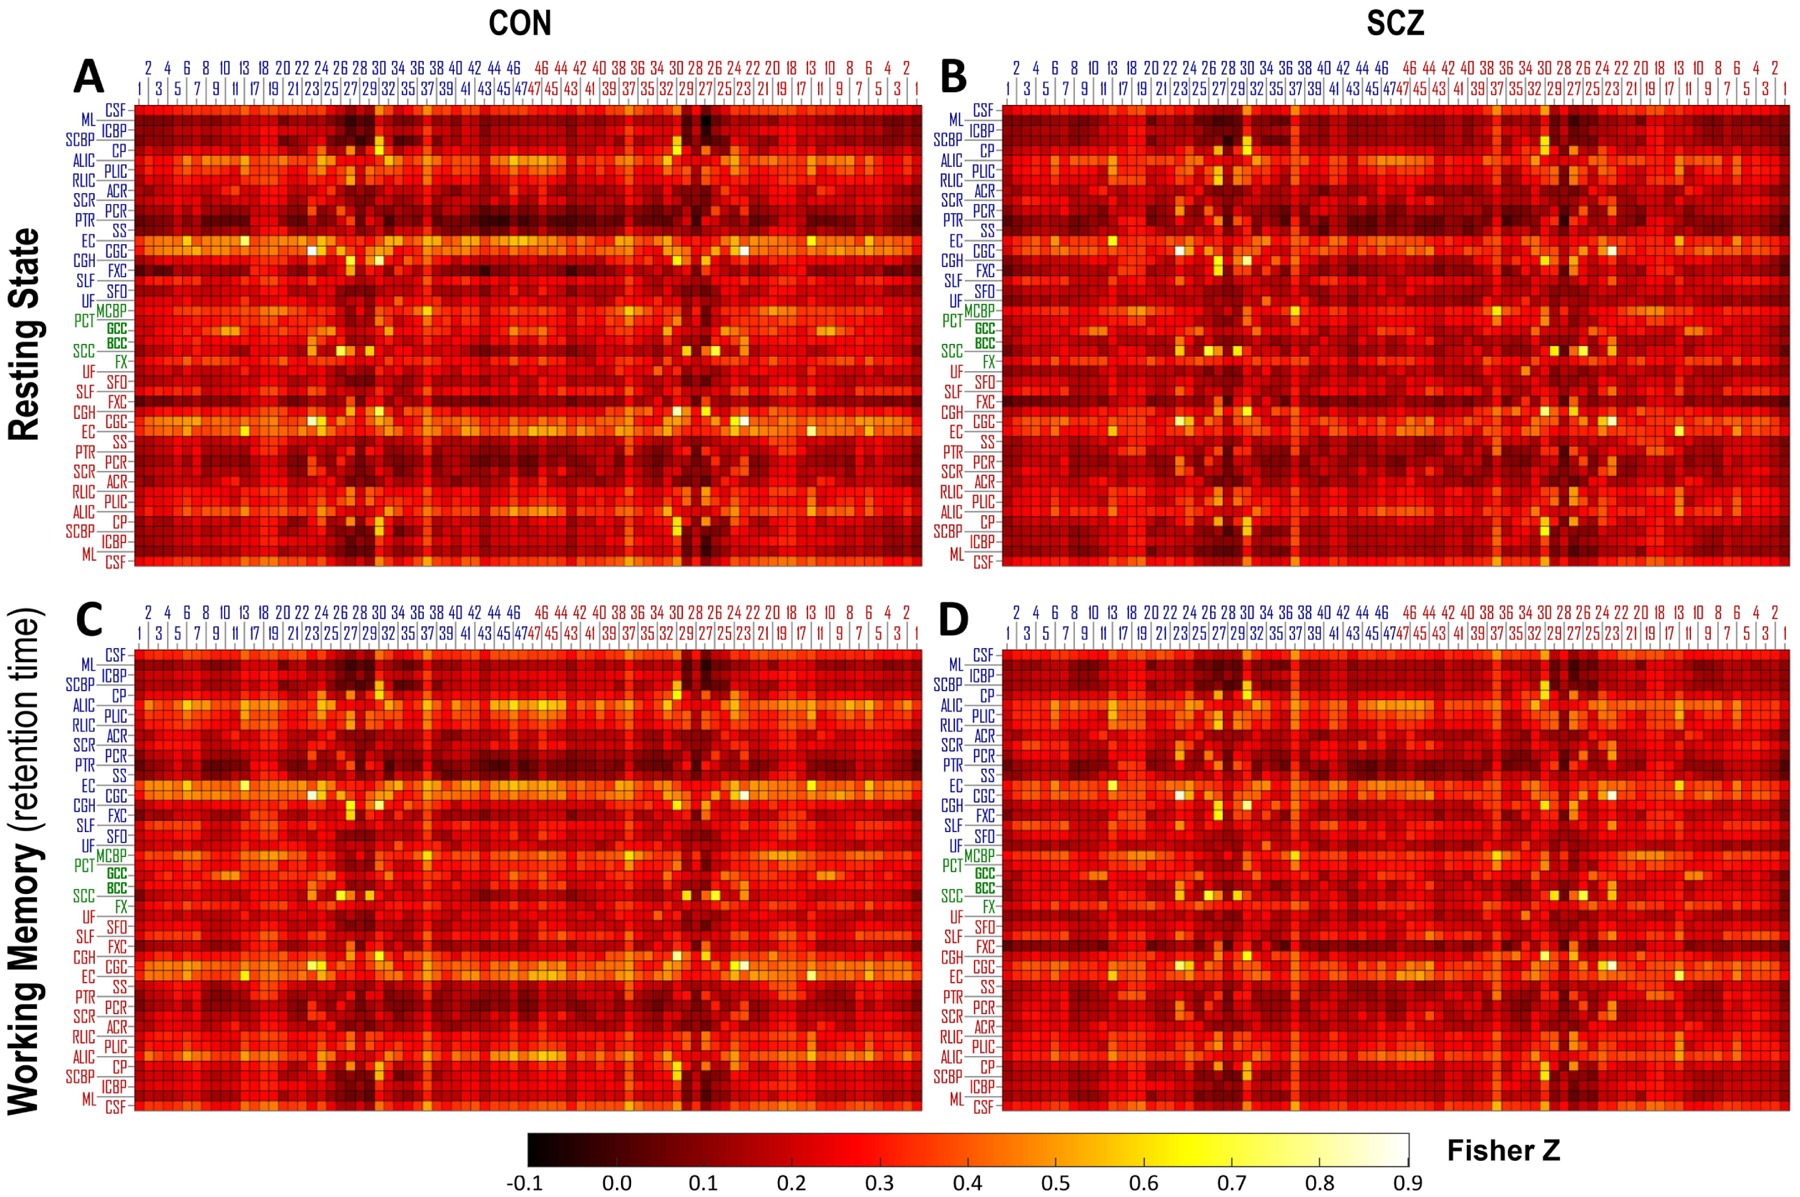
Fig. 2.

Group mean of functional correlation matrix (mFCM) within CON group and SCZ group under two conditions: (A, B) resting state and (C, D) retention period during the spatial working memory task. The blue/red numbers labeling columns of mFCM indicate the indices of Brodmann area (BA) in left/right hemisphere. The blue/green/red abbreviations labeling rows of mFCM indicate the WM bundles in left/middle/right portion of brain. See Table 2 for the lists of these ROIs.
