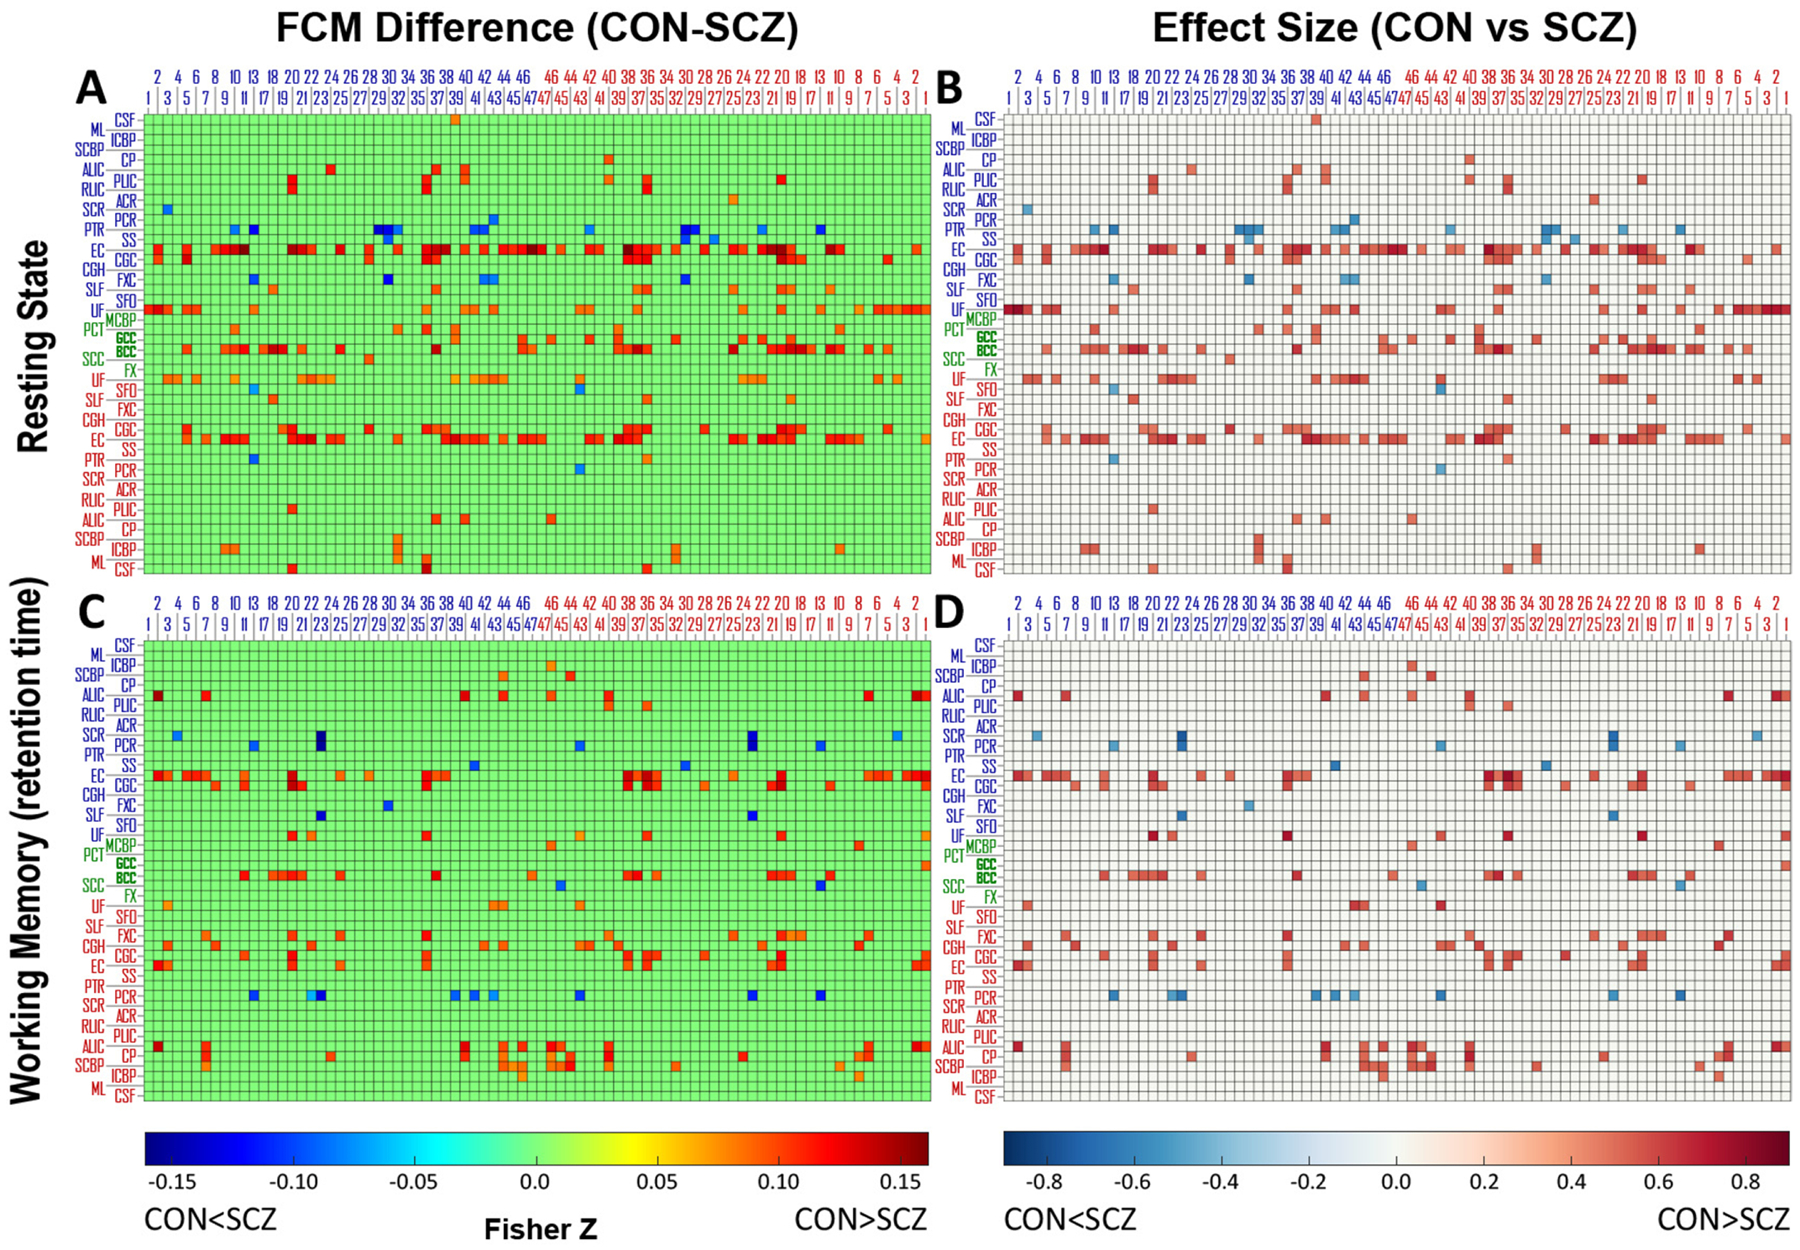
Fig. 3.

Differences and effect sizes of FCM between CON group and SCZ group under two conditions. Difference of subtracting mFCM of SCZ from mFCM of CON and effect size of the difference under two conditions: (A, B) resting state and (C, D) working memory task. The differences of FCM elements with pFDR>0.05 were set to zero and the corresponding effect sizes were also set to zero. The blue/red numbers labeling columns indicate indices of Brodmann areas in left/right hemisphere. The blue/green/red abbreviations labeling rows indicate WM bundles in left/middle/right portion of brain. See Table 2 for the lists of these ROIs.
