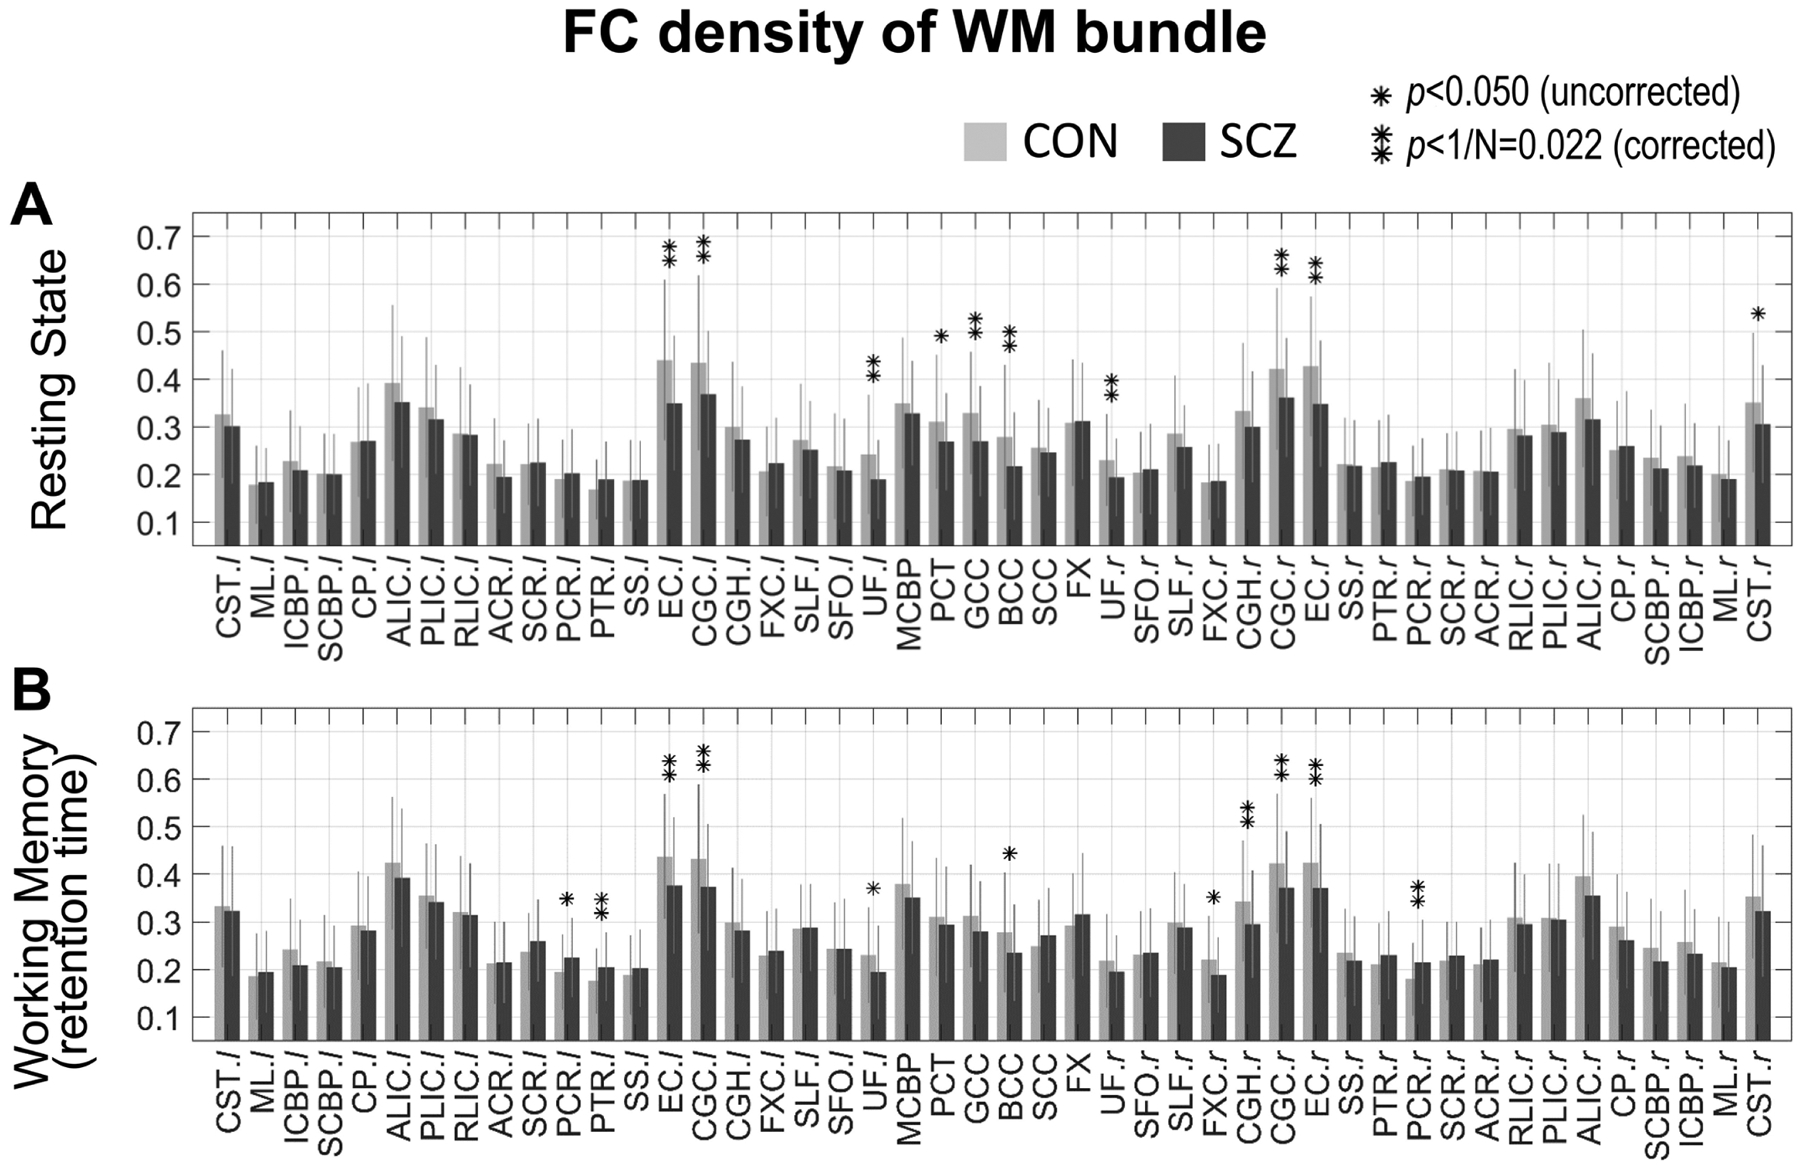
Fig. 4.

Comparison of WM FC density between CON group and SCZ group under two conditions. Mean and standard deviation of FC density within CON group (light gray bar and error bar) and SCZ group (dark gray bar and error bar) under two conditions: (A) resting state and (B) working memory task. * indicates p<0.05 (uncorrected significance level) and ** indicates p<1/N=0.022 (corrected significance level). See Supplementary Table 1 for a summary of group mean, standard deviation and p-values of each WM bundle.
