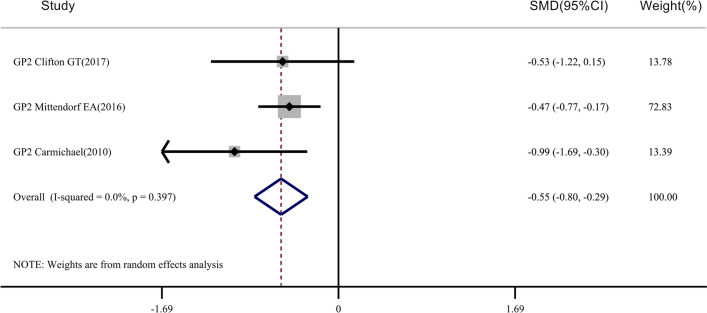
Fig. 4.
Meta-analysis of CD8 + T-cell levels after injection of the GP2 vaccine: STATA 15.0 was used to analyze the 3 clinical studies. The relative standard mean difference (SMD) value and the 95% confidence interval (CI) were used to describe the effect of the vaccine on vaccinated and control patients. Heterogeneity was tested using the Q measurement method (P = 0.397) and the I2 measurement method (I2 = 0.0%). A meta-analysis of CD8+ T-cell levels of 124 patients in the vaccinated group found that there were differences in CD8+ T-cell levels before and after injection (P < 0.05)

