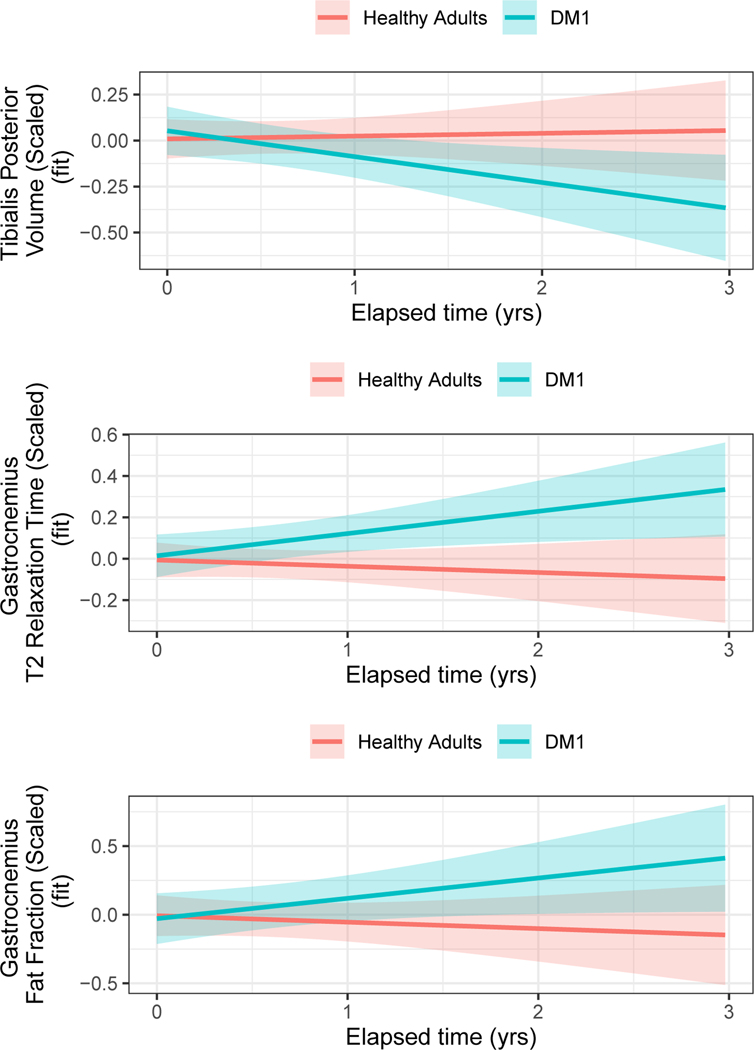
Figure 3. Differences in rates of change across groups.
Group*elapsed time interaction effects were identified for TP volume (top) panel and T2-relaxometry (middle) and FF (bottom) of the GAS. The curves were adjusted for age at baseline, sex and random effects of participants and families. TP volume decreased over time in DM1 patients, while this volume remained stable in unaffected adults (top). GAS T2-relaxation and FF (middle and bottom panels, respectively) showed a significant increase over time in DM1 patients, while these parameters remained stable in unaffected adults.

