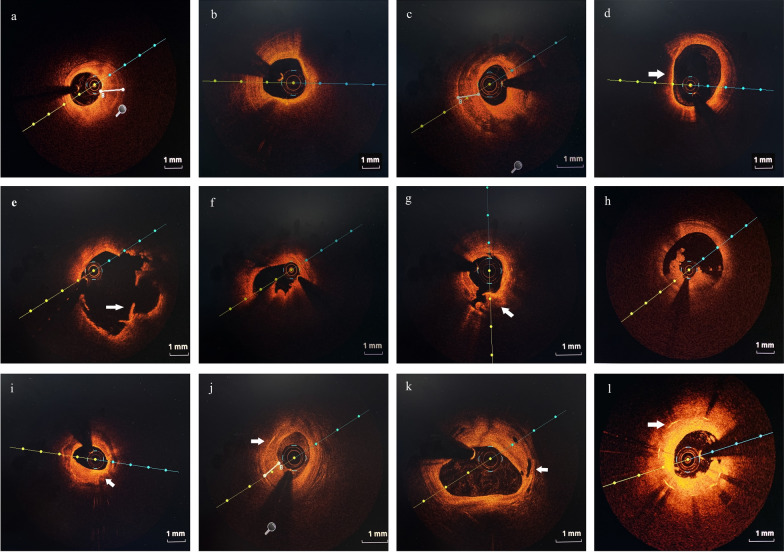
Fig. 2.
Representative cross-sectional optical coherence tomography images of culprit vessels. a Fibrous plaque identified as homogeneous and highly backscattering region. b Lipid-rich plaque identified as a low signal region with a diffuse border. c Calcification identified as sharply-delineated, low-backscattering heterogeneous regions. d Thin-cap fibroatheroma (TCFA) identified as a lipid-rich plaque with the thinnest part of the fibrous cap being less than 65 μm (arrow). e Plaque rupture identified as disruption of the fibrous cap with obvious cavity formation (arrow). f Plaque erosion identified as the presence of attached thrombus overlying an intact and visualized plaque. g Calcified nodule identified as a nodular calcification that protruded to the lumen with thrombus formation (arrow). h Thrombus defined as irregular mass that adhered to the luminal surface including white thrombus, red thrombus, and mixed thrombus. i Macrophages defined as signal-rich, distinct or confluent punctuate regions with heterogeneous backward shadows (arrow). j Cholesterol crystals defined as linear, highly backscattering structures within the plaque (arrow). k Microvessels defined as black holes within a plaque that were presented on at least three consecutive frames (arrow). l In-stent restenosis was defined as stenosis greater than 50% of the vessel lumen diameter (arrow)

