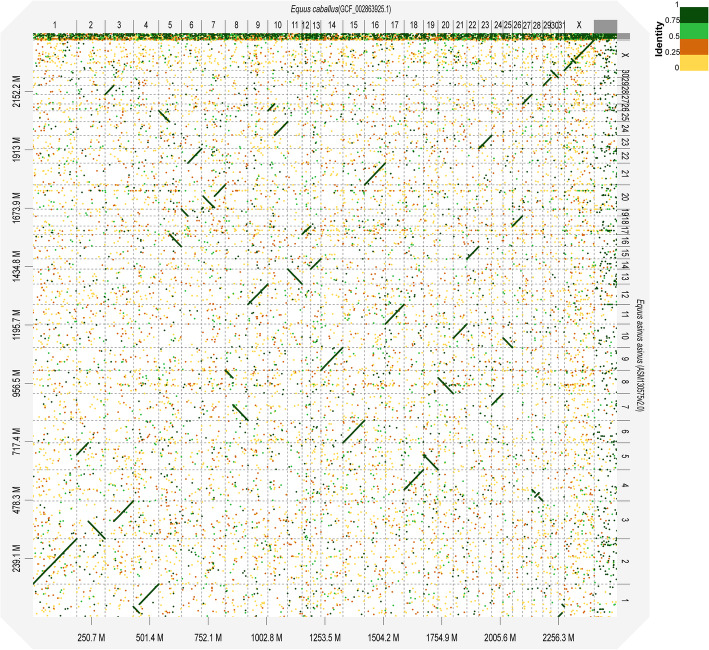
Fig. 1.
Dot-plot alignments of chromosomes of E. caballus (ECA) to E. asinus asinus (EAS) using D-Genies. The aligned segments are represented as dots or lines. The significant inversions included EAS1, EAS4, EAS20, and EASX, aligned to ECA 31 + 4, ECA 28, ECA 7, and ECA X, with sizes of 35, 17, 40, and 15 Mb, respectively. The colors correspond to similarity values that were binned in four groups (< 25, 25–50%, 50–75%, and > 75% similarity)

