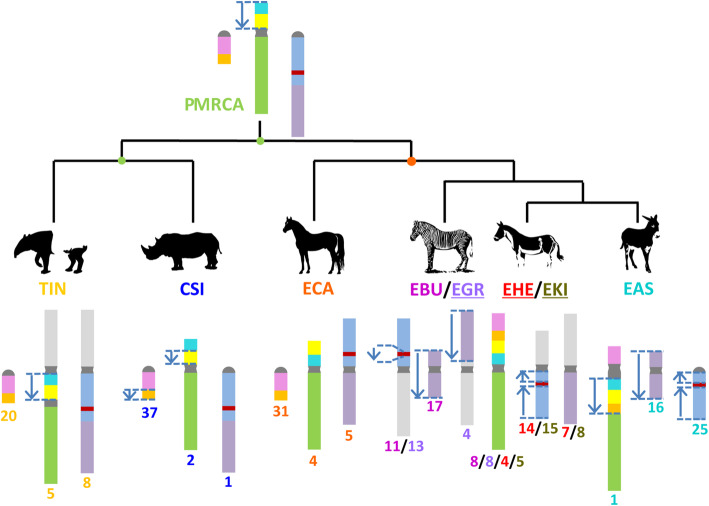
Fig. 5.
Inferred evolution diagram of the donkey chromosome 1 and horse chromosome 5 in perissodactyls. We built a cladogram based on previous research to help understand the evolution of EAS1 and ECA5. The results of subchromosomal comparative mapping and genomic collinearity analysis were summarized in this study using D-Genies and Mauve v2.4.0 among CSI, ECA, Equus burchellii (EBU), Equus grevyi (EGR), Equus hemionus (EHE), Equus kiang (EKI), and Equus asinus asinus (EAS). PMRCA represents the most recent common ancestor (MRCA) of odd-hoofed animals. Each colored region is a locally collinear block (LCB). The blue arrows indicate LCBs that were inverted when compared with horse orthologous regions. The number below the chromosome represents the cytogenetic nomenclature in the karyotype of different species. The underlined abbreviated species names indicate that the structural variation within the chromosome of the species is only inferred and needs to be supported by sequencing data. The light gray chromosome segments represent the fusion of the corresponding chromosomes and not homology

