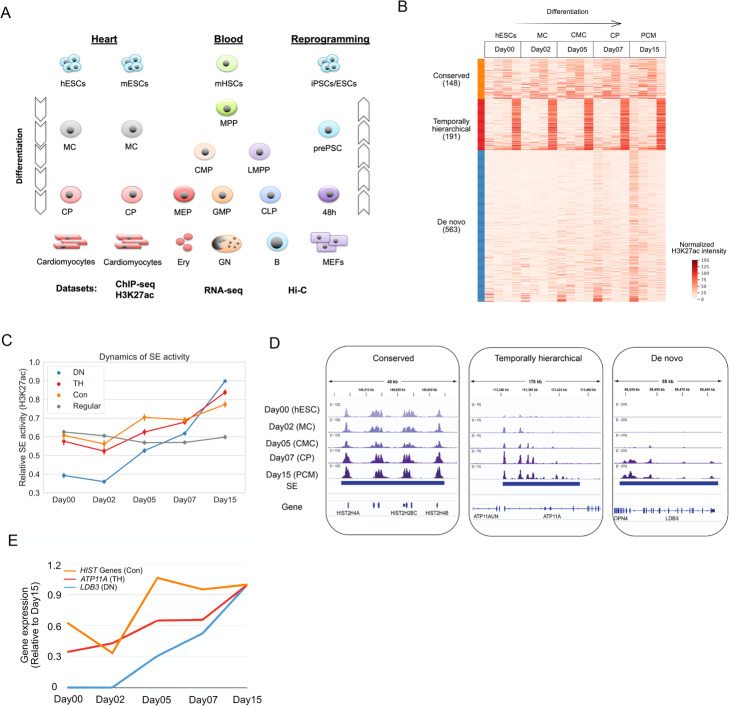
Fig. 1.
Mapping the evolving landscape of SEs reveals three distinct temporal patterns. a An overview of the interrogated systems in this study. b K-means clustering of the SE signal vectors across the five differentiation stages. Each row represents the signals of a SE during differentiation. Each SE is represented by 4 representative elements (sub-columns) generated by a linear interpolation approach (see the “Methods” section for details). c Average dynamic profiles of the three types of SEs during differentiation. Each SE is normalized to its maximum H3K27ac intensity during differentiation and the average profile is shown. d Genome browser snapshots showing typical examples for Con, TH, and DN SEs. The tracks shown are H3K27ac ChIP-seq signals. e Expression profile of the genes shown in d

