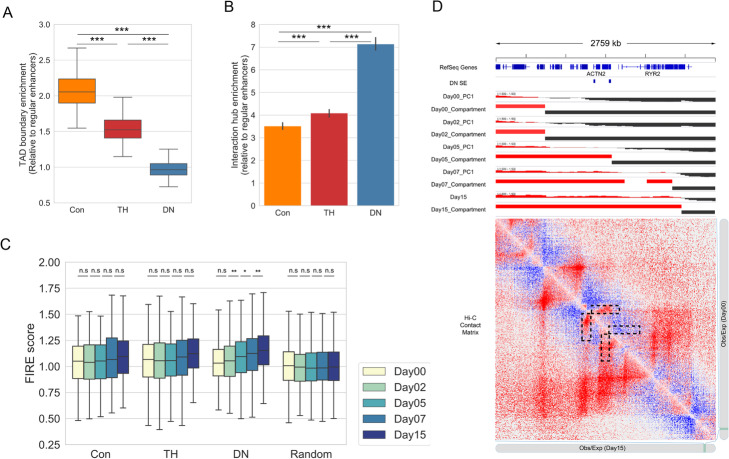
Fig. 3.
Higher-order chromatin features of the three types of SEs. a Box plot showing the fold enrichment of SEs at the TAD boundaries over regular enhancers. ***P < 0.001, Mann-Whitney U test. b Bar graph showing the fold enrichment of the three types of SEs on the FIRE elements in day 15 cells over random regions. ***P < 0.001, Mann-Whitney U test. c Box plot showing the FIRE scores of the three types of SEs during differentiation. n.s., not significant, *P < 0.05, **P < 0.01. P-values are determined by using the Mann-Whitney U test. d Genome browser snapshot showing two DN SEs within dynamic compartments and increased local contacts. Tracks from top to bottom, RefSeq genes, PC1 compartment signals, and compartment types from day 00 and day 15, where red represents compartment A and black represents compartment B. The contact matrix shows interaction patterns for day 00 (above diagonal) and day 15 (below diagonal), respectively. The rectangular boxes indicated by the black dashed lines highlight the increased local contacts in the SE regions

