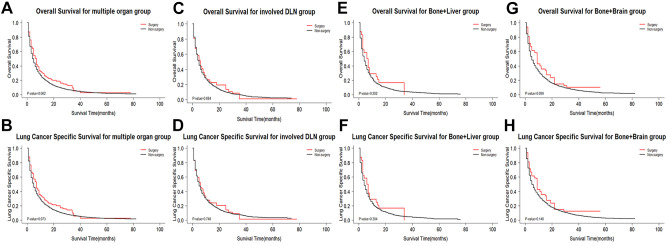
Figure 4.
Kaplan-Meier survival curves comparing OS/LCSS between surgery group and non-surgery group in multiple organ metastases subgroups after CBPS. (A and B) Multiple organ metastases group; (C and D) involved distant lymph node metastases group; (E and F) bone and liver metastases group; (G and H) bone and brain metastases group. OS indicates overall survival; LCSS, lung cancer specific survival; CBPS, covariate balancing propensity score weighting; DLN, distant lymph node.

