
Extended Data Fig. 4 |. Viral targeting and number of cells infected in the vMT.
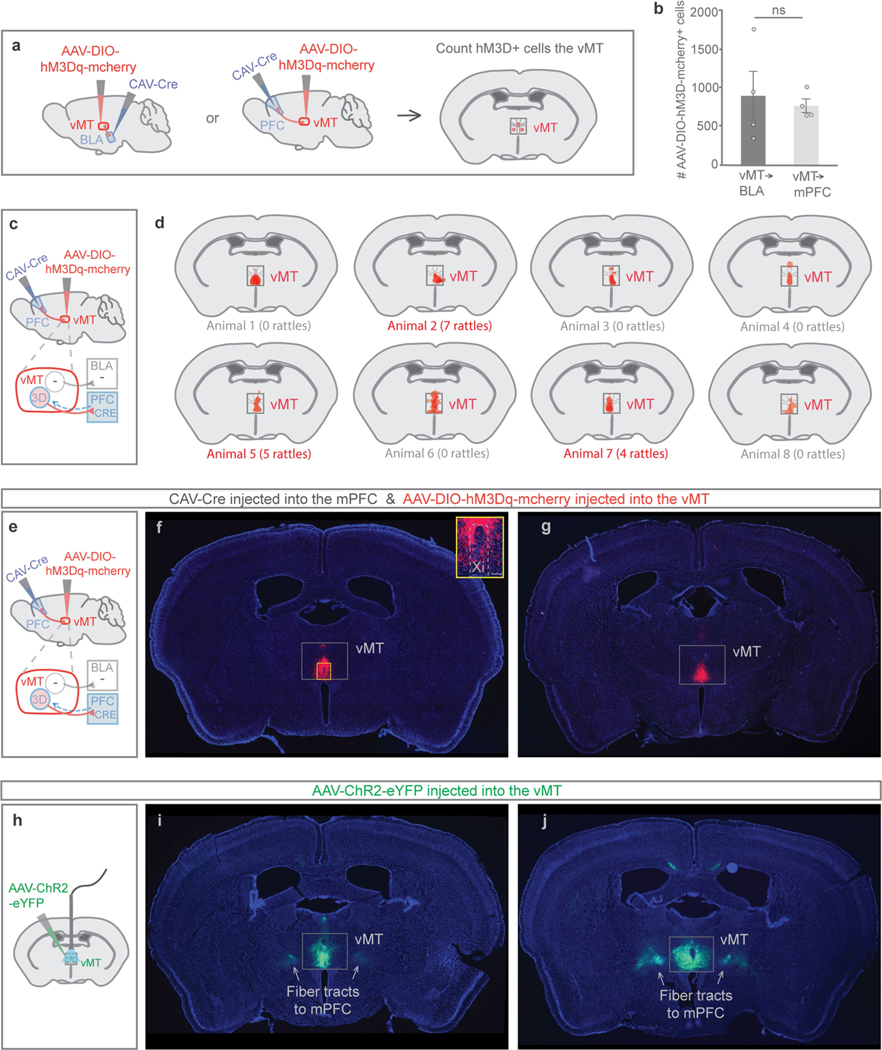
Refers to Figs. 3 and 4. a, To activate vMT neurons that project to the mPFC or the BLA, CAV-Cre was injected into the mPFC or the BLA and Cre-dependent hM3D was injected into the vMT. b, The average number of infected hM3d–mCherry+ vMT cells did not differ between the vMT→BLA and the vMT→mPFC pathway activation groups. c, e, Locations of injections to activate the vMT→mPFC pathway. d, Relative expression of hM3D in vMT→mPFC cells does not scale with tail-rattling behaviour. f, g, Representative images of hM3dq– mCherry/Cre+ neurons (red) in the vMT that project to the mPFC. h, Mice were injected with AAV-ChR2 in the vMT to activate the vMT. i, j, Representative images of ChR2–eYFP+ neurons (green) in the vMT and the fibre tracts composed of vMT axons that project to the mPFC. Data are mean ± s.e.m.; NS, not significant. See Supplementary Table 1 for statistical analysis and sample sizes.