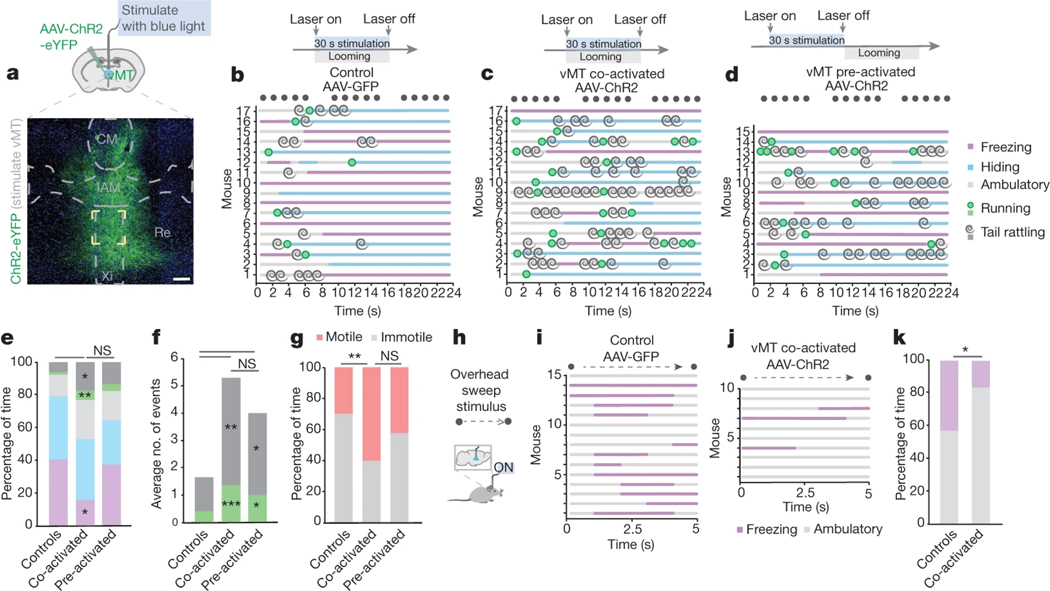
Fig. 4 |. Saliency-enhancing behaviours to threat persist after vMT stimulation.
a, Representative image of ChR2–eYFP+ cells in the vMT. Scale bars, 100 μm. b–d, Ethograms of responses to looming in control mice (b), mice with vMT activated in concert with the loom (c, co-activated) and mice with vMT activated before the loom (d, pre-activated). e–g, Co-activating and pre-activating the vMT increased tail rattling and running (e, duration; f, incidence). Co-activating the vMT decreased freezing (e) and increased total motile behaviours (g). h, Schematic of the overhead-sweep-stimulus experiment. i–j, Ethograms of responses to the overhead sweep stimulus in control mice (i) and mice in which the vMT is activated during the sweep (j). k, Co-activating the vMT decreased freezing in response to the sweep. Data are mean ± s.e.m. *P < 0.05, **P < 0.01, ***P < 0.001. See Supplementary Table 1 for further details of the statistical analyses.

