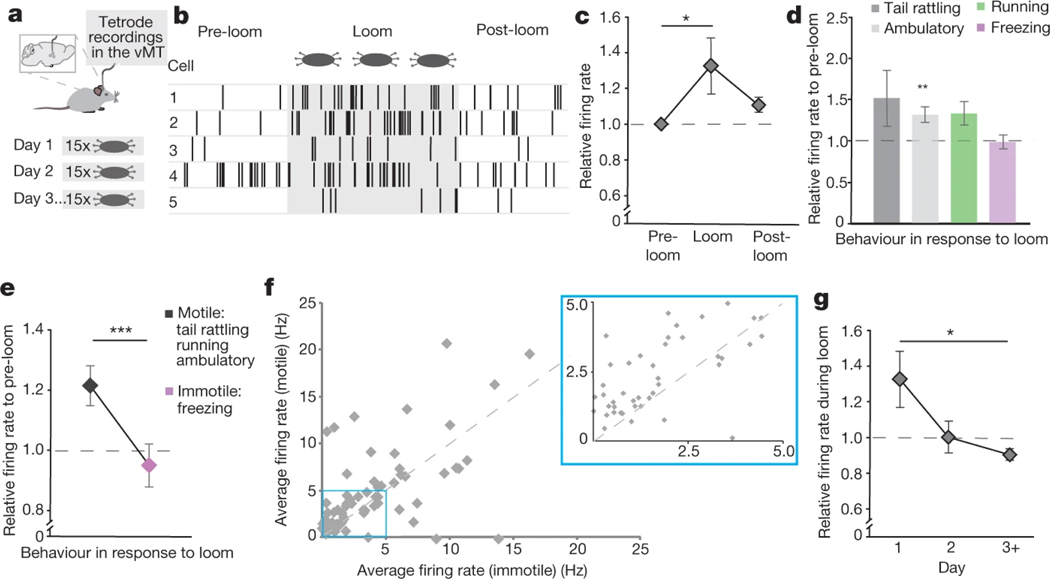
Fig. 6 |. vMT neurons are activated during saliency-enhancing behaviours.
a, Tetrode recordings in the vMT were performed during presentation of the looming stimulus. b, Sample raster plots of five isolated units before, during and after the looming stimulus. c–e, Mean relative firing rates on the first day of loom presentation (c, 23 cells from 4 mice), during different behaviour epochs (d, 87 total cells from 4 mice) and during motile and immotile behaviours (e, 67 cells from 4 mice), relative to pre-loom (dashed line). f, Mean firing rates of all the recorded units during motile behaviour as compared to immotile behaviour in response to looms. Most of the points are above the y = x line. g, Mean relative firing rate across several days of looming presentation (87 total cells across 4 mice). Data are mean ± s.e.m. *P < 0.05, ***P < 0.001. See Supplementary Table 1 for further details of the statistical analyses.

