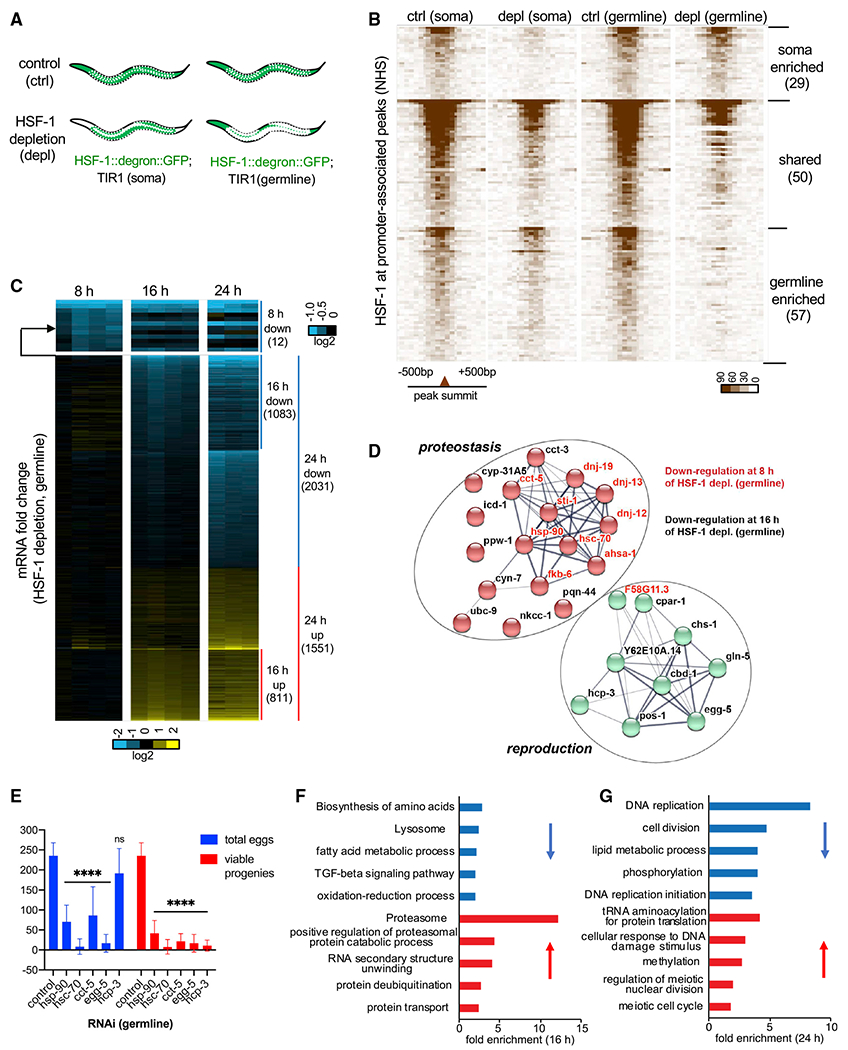
Figure 3. HSF-1 directs a compact transcriptional program important for homeostasis and development of the germline.

(A) Schematic showing tissue distribution of HSF-1 upon acute depletion in the two AID models. White dashed lines outline gonads.
(B) Heatmaps of HSF-1 occupancy at ChIP-seq peaks (normalized HSF-1 reads mapped to 50-bp bins, ±500 bp from peak summits) that are at promoters (within 1,000 bp from the transcription start sites) of protein-coding genes (PCGs). The two AID models were grown to young adults at 20°C (non-heat-shock [NHS] condition)and treated with auxin for 2 h (depletion [depl]) or mock-treated (control [ctrl]). HSF-1 peaks were grouped into “soma enriched” or “germline enriched” when HSF-1 occupancy at the peaks decreases significantly upon depl from the corresponding tissue but not the other or grouped into “shared” when HSF-1 occupancy decreases significantly upon depl in both (P: 10e–10). The peaks in each group were ranked by the average HSF-1 occupancy under the two “ctrl” conditions. The number of peaks in each group is shown in parentheses.
(C) Heatmap of mRNA fold change upon depl of HSF-1 from the germline of young adults for 8, 16, and 24 h. Whole-animal RNA-seq analyses were done in four biological replicates for the 8-h and 16-h time points and in triplicates for the 24-h time point. TIR1; HSF-1::degron::GFP (auxin) was used as the HSF-1 depl condition, and TIR1; HSF-1::degron::GFP(mock treated), TIR1 (auxin), and TIR1 (mock treated) were pooled together as the ctrl. The mRNA fold change (HSF-1 depl/ctrl) is shown. Differentially expressed (DE) genes (false discovery rate [FDR], 0.05; fold change ≥ 1.25) at any time point were included and ranked by fold change at 8 h, then 16 h, and last, 24 h. The number of PCGs in each group is shown in parentheses.
(D) The gene network directly activated by HSF-1 in germline development. Genes included are those with HSF-1 binding peaks at the promoters and significantly decreased expression upon HSF-1 depl from the germline for 8 h (gene names in red) or 16 h (gene names in black). The protein-protein interaction network was retrieved from the STRING database and grouped by k-means clustering (n = 2). The node color represents the cluster to which the gene belongs (red, proteostasis; green, reproduction). The color saturation of edges represents the confidence score of a functional interaction.
(E) Brood size analyses with germline-specific RNAi. The numbers of eggs and viable progeny were scored. EGG-5 RNAi likely knocked down its paralog EGG-4 as well, based on sequence similarity. Data are represented as mean ± standard deviation (n ≥ 12). Statistical significance was calculated by unpaired, two-tailed Student’s t test relative to the ctrl RNAi (empty vector of L4440). ****p < 0.0001.
(F and G) Gene Ontology (GO) analyses of DE genes by HSF-1 depl from the germline for 16 h (F) and 24 h (G). The top5 GO terms based on enrichment score are shown for downregulated genes (blue bars) and upregulated genes (red bars).
