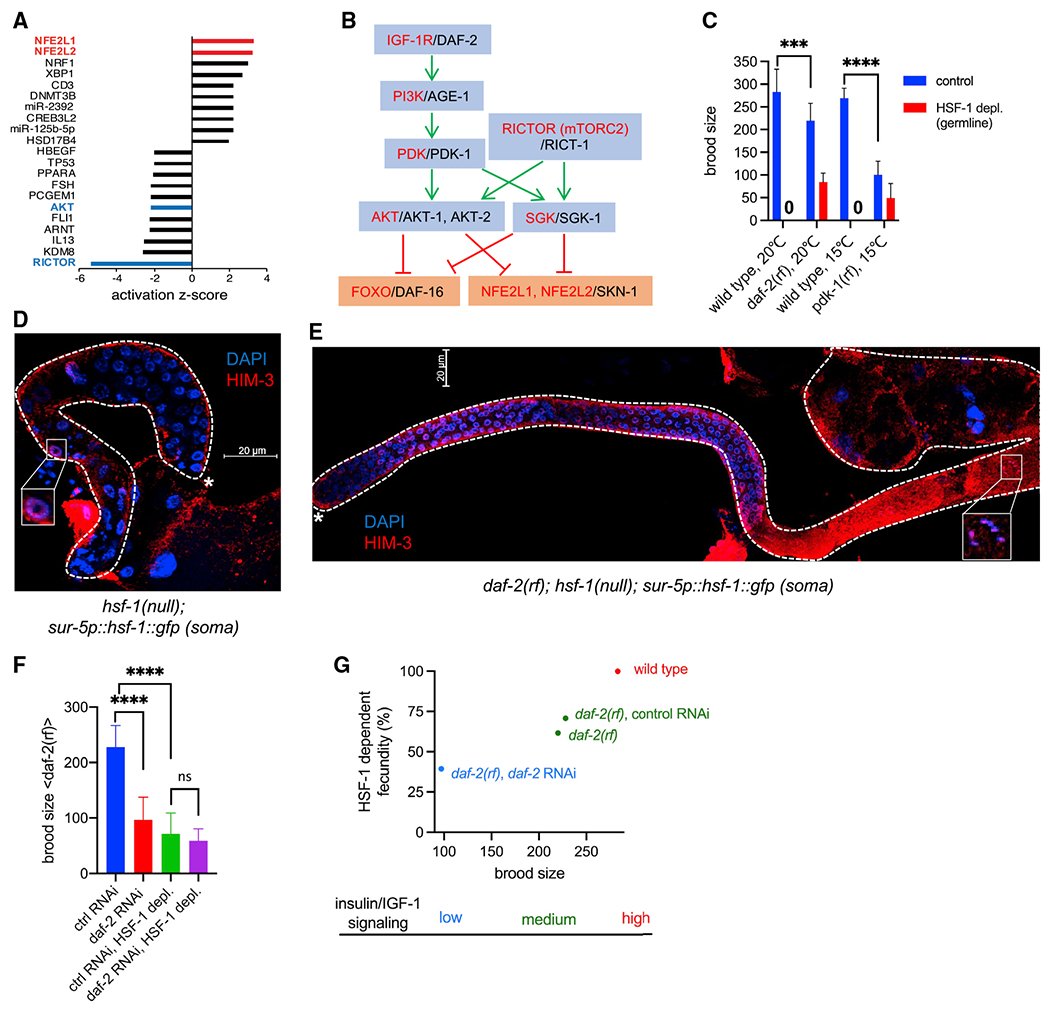
Figure 5. HSF-1 is required for IIS-promoted reproduction.

(A) Bar graph of activation Z scores from IPA of transcriptome changes at 16 h of HSF-1 depl from the germline. The activation Z score is a statistical measurement of the activation status of upstream regulators of DE genes (positive Z score, activation; negative Z score, inhibition).
(B) Schematic of the linked IIS and mTORC2 signaling transduction pathway (Blackwell et al., 2019; Hertweck et al., 2004; Murphy and Hu, 2013; Sarbassov et al., 2005). Human protein names are shown in red, and C. elegans ortholog names are shown in black. Green pointed arrows denote activation, and red blunt-ended arrows denote repression.
(C) Brood size of the wild-type, daf-2(rf), and pdk-1(rf) animals upon depl of HSF-1 from the germline since egg lay. The pdk-1(rf) mutants were grown at 15°C to avoid developmental defects at higher temperature. Data are represented as mean ± standard deviation (n ≥ 15). Statistical significance was calculated by unpaired, two-tailed Student’s t test. ***p < 0.001, ****p < 0.0001.
(D and E) Representative images showing IF of the meiotic marker HIM-3 in dissected gonads with DAPI staining of DNA. hsf-1(null) animals that express the hsf-1::gfp transgene from the pan-soma sur-5 promoter (D) showed meiotic arrest at pachytene (boxed image), whereas animals carrying an additional daf-2(rf) allele (E) successfully entered oogenesis (boxed image showing a nucleus at diakinesis). Dashed lines outline gonads, and the white asterisks indicate the distal end of gonads. Scale bars, 20 μM.
(F) Brood size of daf-2(rf) animals treated with daf-2 RNAi or the empty vector of L4440 as ctrl (ctrl RNAi) upon depl of HSF-1 from the germline. Depl of HSF-1 and RNAi started since egg lay. Data are represented as mean ± standard deviation (n ≥ 20). Statistical significance was calculated by unpaired, two-tailed Student’s t test. ****p < 0.0001; ns, p > = 0.05.
(G) Correlation of total brood size and HSF-1-dependent fecundity in animals with different IIS activities. HSF-1-dependent fecundity is calculated as the percent of brood size decrease upon depl of HSF-1 from the germline (as in C and F).
