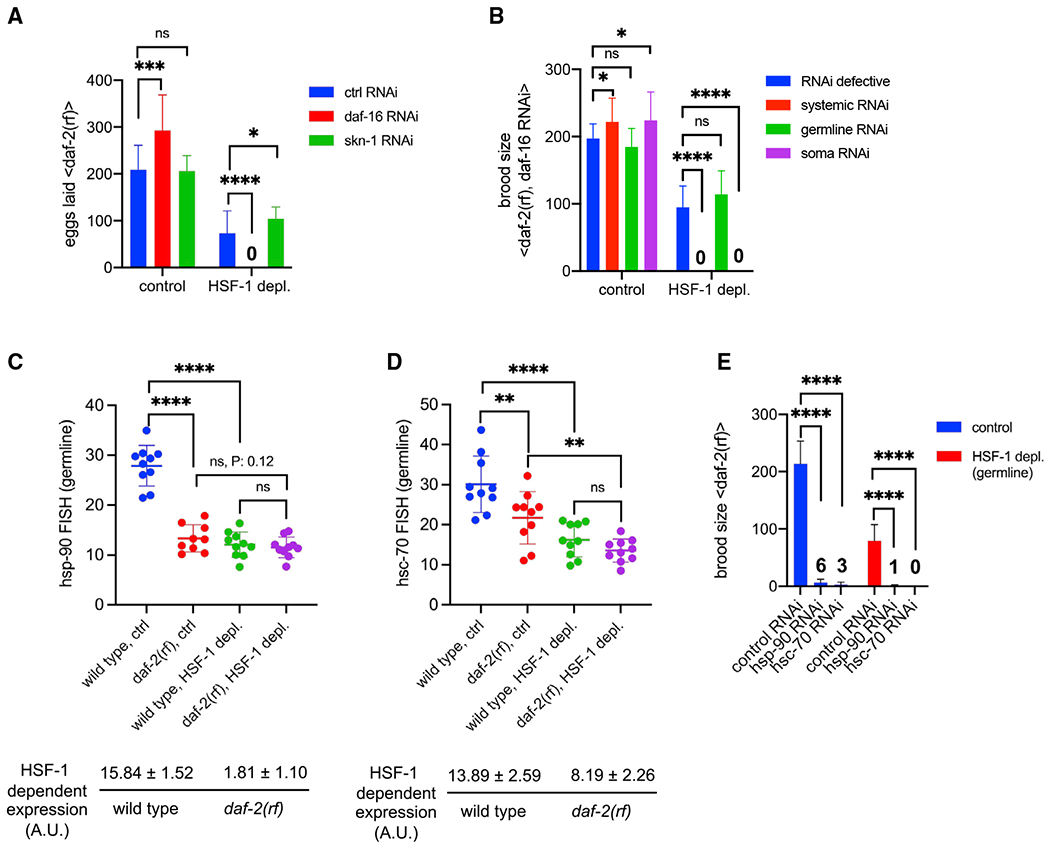
Figure 6. IIS activates HSF-1-dependent expression of hsp-90 and hsc-70 in germline development.

(A) Histograms showing the number of eggs laid by daf-2(rf) animals with systemic RNAi treatment against DAF-16 or SKN-1. The empty vector of L4440 was used as the Ctrl (ctrl RNAi). Depl of HSF-1 from the germline and RNAi started since egg lay. Data are represented as mean ± standard deviation (n ≥ 15). Statistical significance was calculated by unpaired, two-tailed Student’s t test. *p < 0.05, ***p < 0.001, ****p < 0.0001; ns, p > = 0.05.
(B) Histograms showing brood size of the daf-2(rf) animals with RNAi treatment against DAF-16. RNAi was done in genetic models that are RNAi defective (negative Ctrl) or enable RNAi to occur systemically only in the germline or in the soma. Depl of HSF-1 from the germline and RNAi started since egg lay. Data are represented as mean ± standard deviation (n > 15). Statistical significance was calculated by unpaired, two-tailed Student’s t test. *p < 0.05, ***p < 0.001, ****p < 0.0001; ns, p > = 0.05.
(C and D) Scatter dot plot showing the fluorescence intensity of hsp-90 (C) and hsc-70 (D) RNA-FISH in the germline of wild-type and daf-2(rf) animals that were mock treated as the Ctrl or treated with auxin to deplete HSF-1 from the germline since egg lay (HSF-1 depl). Mean and standard deviation are plotted. Statistical significance was calculated by unpaired, two-tailed Student’s t test. **p < 0.01, ****p < 0.0001; ns, p > = 0.05. HSF-1-dependent expression in the germline was calculated as fluorescence intensity in the Ctrl minus HSF-1-depleted animals, a.u., arbitrary units of fluorescence.
(E) Brood size analyses with germline-specific RNAi in the daf-2(rf) mutant. Depl of HSF-1 from the germline and RNAi started since egg lay. Data are represented as mean ± standard deviation (n > 15). Statistical significance was calculated by unpaired, two-tailed Student’s t test. ****p < 0.0001. The average brood sizes of animals with hsp-90 and hsc-70 RNAi are labeled.
