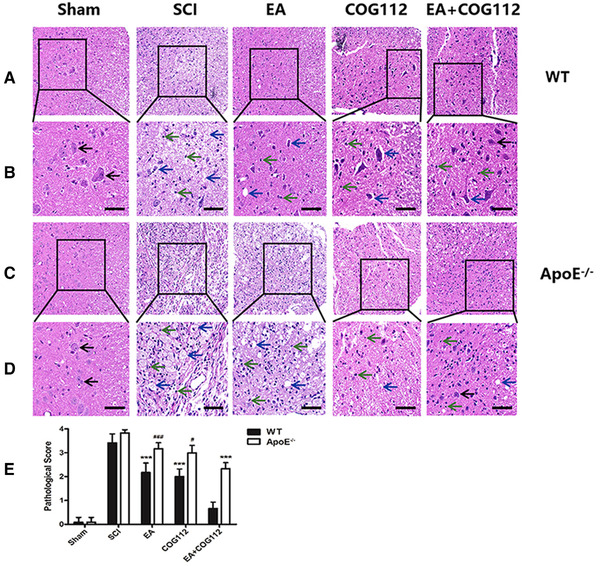
FIGURE 2.

Micrographs of hematoxylin‐ and eosin‐stained spinal cord tissue near the epicenter of damage at 28 days after SCI (n = 6 mice per group). (a) WT mice. (b) The local enlarged pictures from panel (a). (c) ApoE −/− mice. (d) The local enlarged pictures from panel (c). (e) Quantitative analysis of pathology scores from experiments. Scale bar: (a, c) 50 μm; (b, d) 20 μm. Black arrows point to normal neurons; blue arrows, to apoptotic or necrotic neurons; and green arrows, to inflammatory cytokines. All data are mean ± SD.
Abbreviations: ApoE, apolipoprotein E; EA, electroacupuncture; SCI, spinal cord injury; WT, wild type. *** p < .001 vs. WT EA+COG112 group. # p < .05, ### p < .001 vs. ApoE –/– EA+COG112 group
