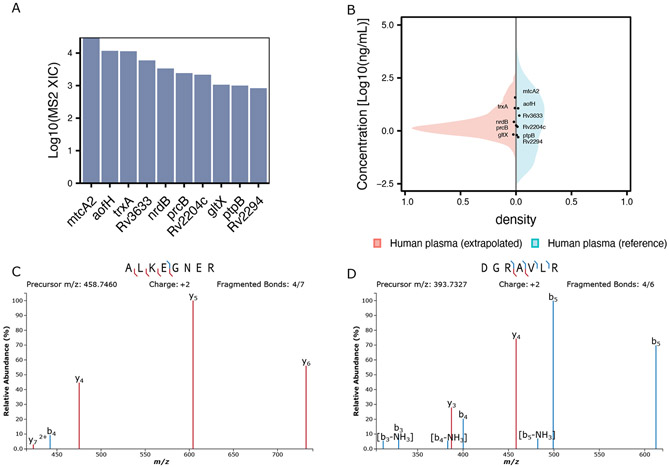
Figure 3. Coverage of Mtb proteins using orthogonal proteases.
A Barplot showing recovery of Mtb proteins in the pooled spectral library. B Mirror plot showing the extrapolated concentration for TB proteins (black dots) versus the reference concentrations from the Human Protein Atlas (blue density) and the extrapolated intensity for the remaining proteins in the spectral library (red density). C, D Annotated MS2 spectrum for two proteotypic mtcA2 peptides identified using Trypsin (C) or AspN (D).

