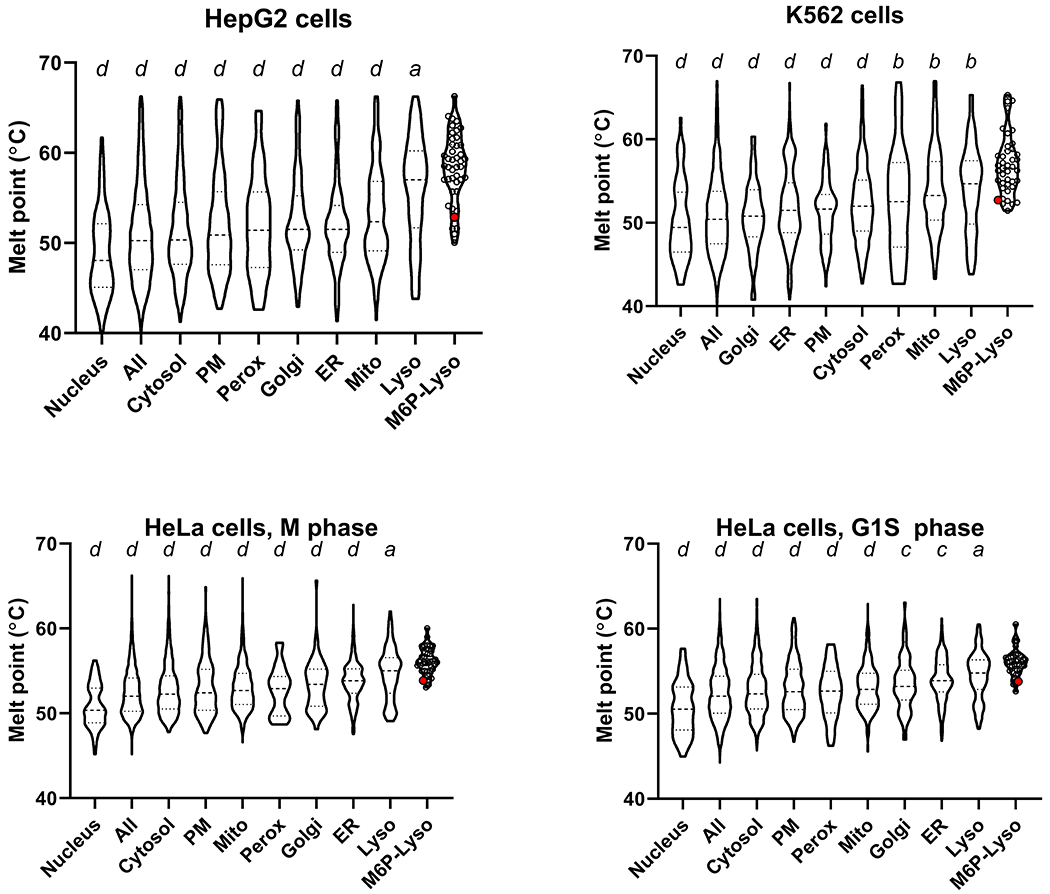
Figure 9. Meta-analysis of cellular thermal proteome profiling studies.

Data used to generate plots are in Supplemental Spreadsheet 1. Quartiles are labeled via dashed lines. Values for individual proteins are shown by open circles for the M6P-Lyso set with the large red circle representing TPP1. Results using oneway ANOVA with Dunnett’s correction for multiple comparisons of M6P-lyso against all other categories are denoted above each violin plot: a ≤0.05; b≤ 0.01; c≤0.001; d≤0.0001. Abbreviations: PM, plasma membrane; Mito, mitochondria; Perox, peroxisomes; ER, endoplasmic reticulum; Lyso, lysosomes; M6PLyso, luminal lysosomal proteins targeted via the M6P pathway.
