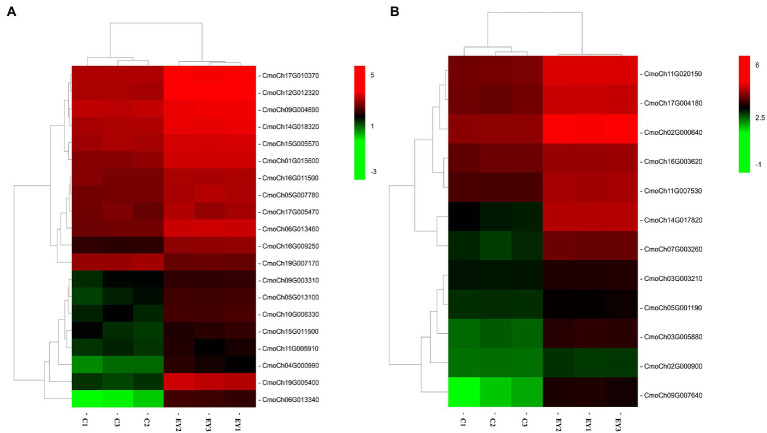
Figure 5.
Heatmap diagram of expression levels of DEGs in significant enrichment KEGG pathways. (A) DEGs enriched in plant hormone signal transduction pathway. (B) DEGs enriched in cysteine and methionine metabolism pathway. The red and green colors indicate high and low expression levels (log2 FPKM), respectively.

