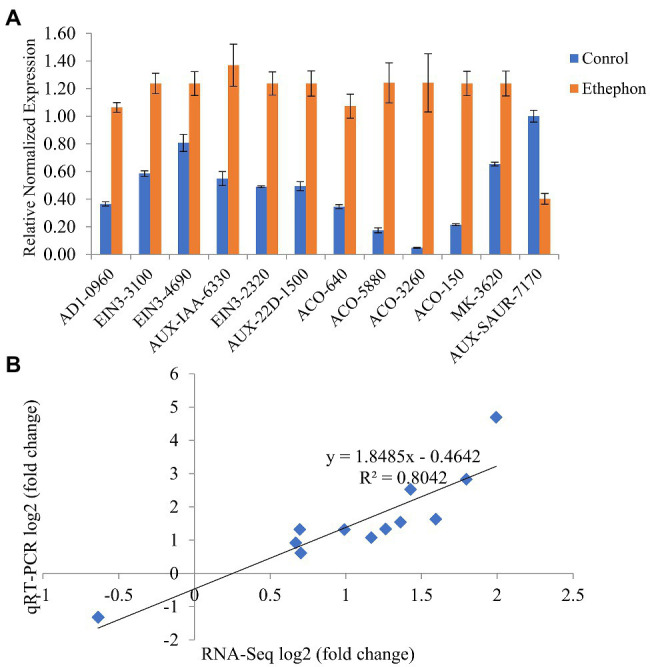
Figure 6.

Quantitative real-time PCR (qRT-PCR) verification. (A) Relative expression levels of 12 selected DEGs between ethephon-treated and control plants. Error bars indicate the SEs. (B) Correlation analysis of RNA-seq log2 (fold change) and qRT-PCR log2 (fold change) of 12 selected genes: AD1-0960 (CmoCh09G010960.1), ETHYLENE INSENSITIVE 3 (EIN3)-3100 (CmoCh05G013100.1), EIN3-4690 (CmoCh09G004690.1), AUX-IAA-6330 (CmoCh10G006330.1), EIN3-2320 (CmoCh12G012320.1), AUX-22D-1500 (CmoCh15G011500.1), AUX-SAUR-7170 (CmoCh19G007170.1), ACO-640 (CmoCh02G000640.1), ACO-5880 (CmoCh03G005880.1), ACO-3260 (CmoCh07G003260.1), ACO-150 (CmoCh11G020150.1), and MK-3620 (CmoCh16G003620.1).
