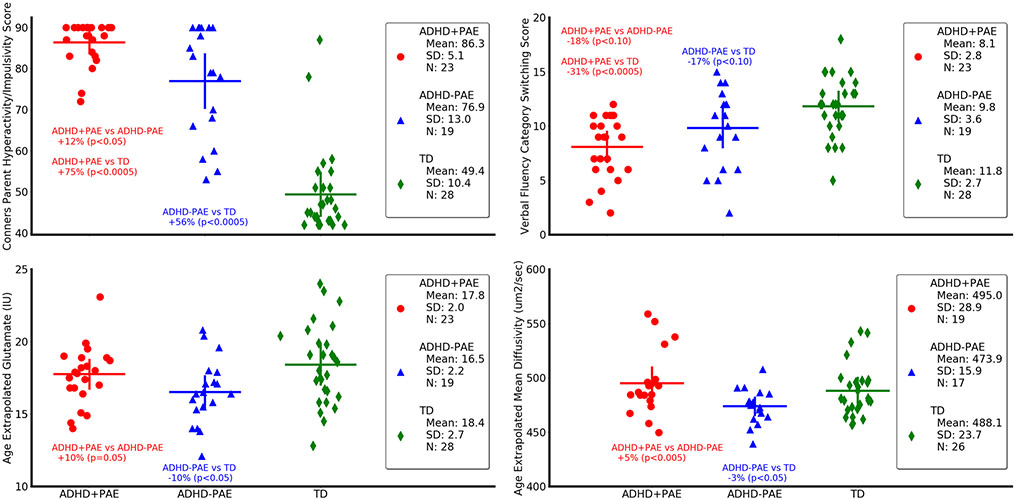
Fig. 3.
Neurobehavioral (upper panels) and neuroimaging (lower panels) metrics differ in children with attention deficit-hyperactivity disorder with prenatal alcohol exposure (ADHD+PAE; red circles) from those with familial attention deficit-hyperactivity disorder without prenatal alcohol exposure (ADHD-PAE; blue triangles), and typically developing controls (TD; green diamonds). Means and standard deviations are depicted by horizontal and vertical lines, respectively. In ADHD+PAE, the Conners Hyperactivity/Impulsivity Score was 12.2% higher than in ADHD-PAE (p < 0.05; post hoc protected Mann-Whitney U-test following omnibus Kruskal-Wallis test) and 74.8% higher than in TD (p < 0.005). The Conners Hyperactivity/Impulsivity Sore was also 55.8% higher in ADHD-PAE than in TD (p < 0.005). The Verbal Fluency Category Switching Score from the Delis-Kaplan Executive Function System significantly distinguished ADHD+PAE from TD (− 31,6%, p < 0,.0005), but only distinguished ADHD+PAE from ADHD-PAE (− 17.8%, p < 0.10 trend) and ADHD-PAE from TD (− 16.7%, p < 0.10) at trend level. Glutamate in supraventricular white matter was 9.6% higher (p = 0.05) in ADHD+PAE than in ADHD-PAE and 10.3% lower (p < 0.05) in ADHD-PAE than in TD. Mean diffusivity (MD) of supraventricular white matter was 5.4% higher (p < 0.005) in ADHD+PAE than in ADHD-PAE. Similar results (not shown) were observed for axial diffusivity (2.8%, p < 0.05) and radial diffusivity (6.1%, p < 0.05). Also, mean diffusivity was 2.9% lower in ADHD-PAE than in TD (p < 0.05). Although there is overlap between groups for all metrics, these findings suggest brain differences between the PAE and familial etiologies of ADHD. All metrics are adjusted for participant age. IU (Institutional Units)

