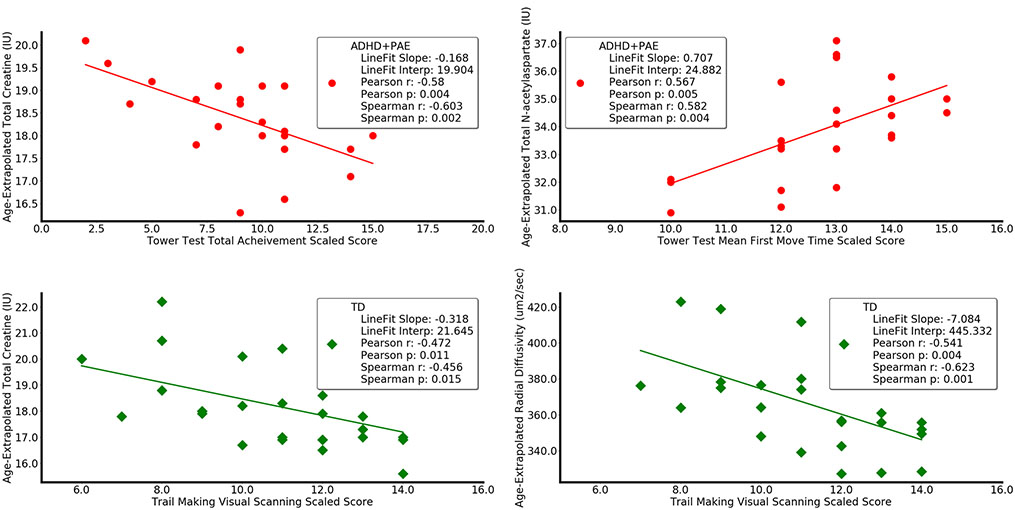
Fig. 4.
Selected correlation analysis (including linear regression and Pearson and Spearman correlation coefficients with p-values) between neurobehavioral and neuroimaging metrics in children with ADHD+PAE (red circles, upper) and in TD (green diamonds, lower). In ADHD+PAE, the Tower Test Total Achievement Score decreased with increasing creatine in supraventricular white matter (r = − 0.60, p < 0.005). Similar results (not shown) were observed for glutamate (r = − 0.41, p = 0.05) and choline (r = − 0.42, p < 0.05). Higher Tower Test Mean First Move Time (indicating inferior performance) accompanied higher levels of N-acetylaspartate (r = 0.59, p < 0.05). A similar result (not shown) was observed for glutamate (r = 0.49, p < 0.05). In TD, Trail Making Test Visual Scanning Score decreased (i.e., worse performance) for increasing creatine (r = 0.59, p < 0.05) and for increasing radial diffusivity (r = − 0.62, p = 0.001). A complementary opposite result (not shown) was observed for fractional anisotropy (r = 0.53, p = 0.005). All metrics are adjusted for participant age

